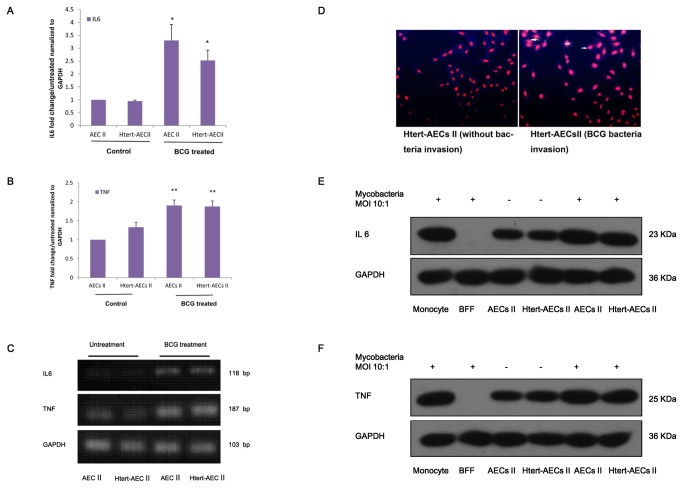
Figure 5. Real-time PCR analysis of TNF-α and IL-6 production by immortalized AEC II cells.
A: Relative expression of IL-6 by AEC II and immortalized HTERT-AEC II cells invaded by BCG. Fold-changes in expression are presented as mean ± SEM and were compared by one-way ANOVA followed by Newman-Keuls test. *P < 0.05). B: Relative expression of TNF-α by AEC II and immortalized HTERT-AEC II cells invaded by BCG. Fold-changes in gene expression are presented as mean ± SEM and were compared by one-way ANOVA followed by Newman-Keuls test. **P < 0.01). C: Semi-quantitative expression of TNF-α and IL-6. D: BCG bacteria were detected by Auramine O staining, and the negative control included HTERT-AEC II cells that had not been infected by bacteria (left image). The yellow spot in the test result indicates the bacteria that have invaded HTERT-AEC II cells (right image). E: Western blot analysis of IL-6. IL-6 was detected from concentrated cell medium, and GAPDH was detected from cells. The positive control included RAW264.7 cells, and the negative control included BFF cells. F: Western blot analysis of TNF. TNF was detected from concentrated cell medium, and GAPDH were detected from cells. The positive control included RAW264.7 cells, and the negative control included BFF cells.

