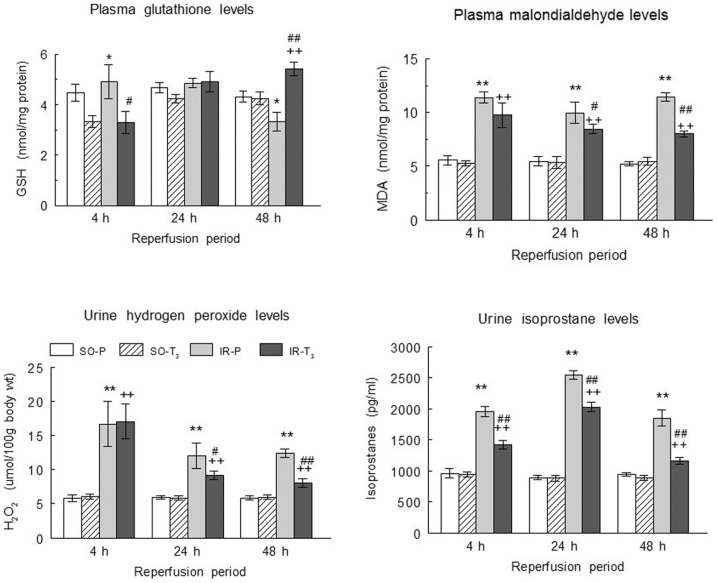
Figure 1. Plasma glutathione and MDA levels, and total urinary excretion of hydrogen peroxide and of isoprostanes.
(Upper panels) Plasma glutathione and MDA levels, and (lower panels) total urinary excretion of hydrogen peroxide and of isoprostanes in the experimental groups (n = 10 each group),: SO-P = sham-operated-placebo; SO-T3 = sham-operated, T3-treated (100 μg/kg); IR-P = ischemia-reperfusion, placebo-treated; IR-T3 = ischemia-reperfusion, T3-treated. Data are means ± SEM. * p<0.05, ** p<0.001 versus SO-P group. + p<0.01, ++ p<0.001 versus SO-T3 group. # p<0.05, ## p<0.001 versus IR-P group.

