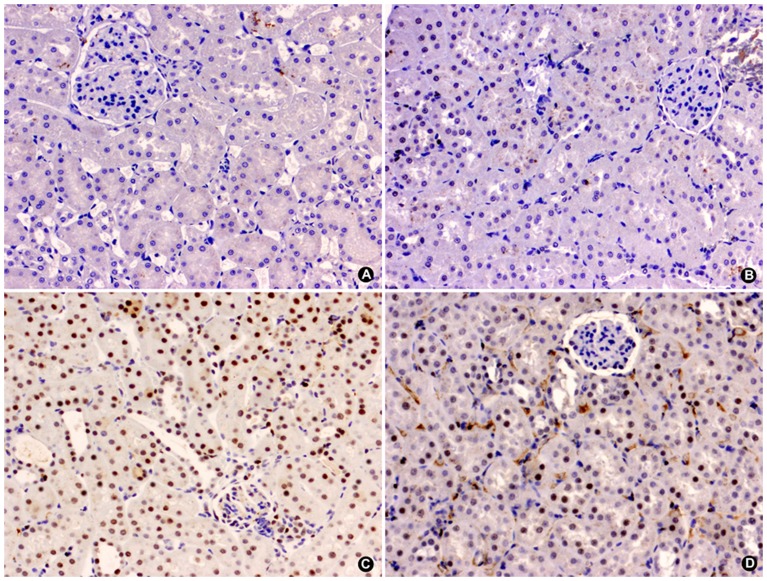
Figure 5. Representative microphotograph of the immunohistochemistry study of PARP-1 expression in renal cortex of male Wistar rats after 48 h of ischemia-reperfusion.
Absence of nuclear expression in SO-P (A) and SO-T3 (B) groups. The IR-P group (C) shows intense nuclear expression (brown deposit) in >80% of tubular cells. The IR-T3 group (D) shows moderate nuclear expression in <20% of tubular cells (micropolymer peroxidase conjugated, original magnification ×20).

