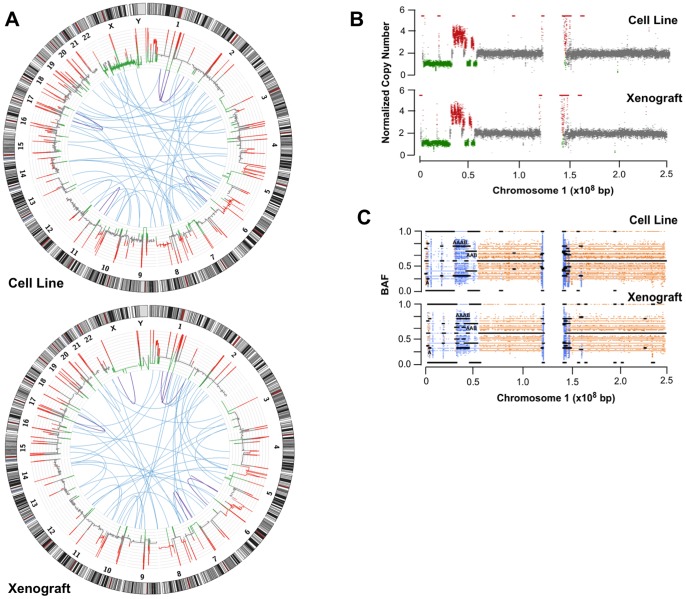
Figure 3. Copy number variations, inter and intra-chromosomal rearrangements and B allele frequencies of NCI-H209 cell line and a xenograft tumour derived from it.
(A) Circos plot representing copy number variations, inter and intra-chromosomal rearrangements of NCI-H209 cell line and a xenograft tumour derived from it. Copy number variations (red, gain; green, loss) were calculated based on coverage using the correspondent peripheral blood as control. Inter and intra-chromosomal rearrangements are represented in blue (inter-chromosomal) and dark blue (intra-chromosomal). (B, C) Detailed profile of copy number variations and B-allele frequencies of chromosome 1 from the analysed cell line and xenograft. As described above, the correspondent peripheral blood was used as control for both type of analysis. Copy number profiles are shown in red (gain), green (loss) and grey (no change). LOH are shown light blue.

