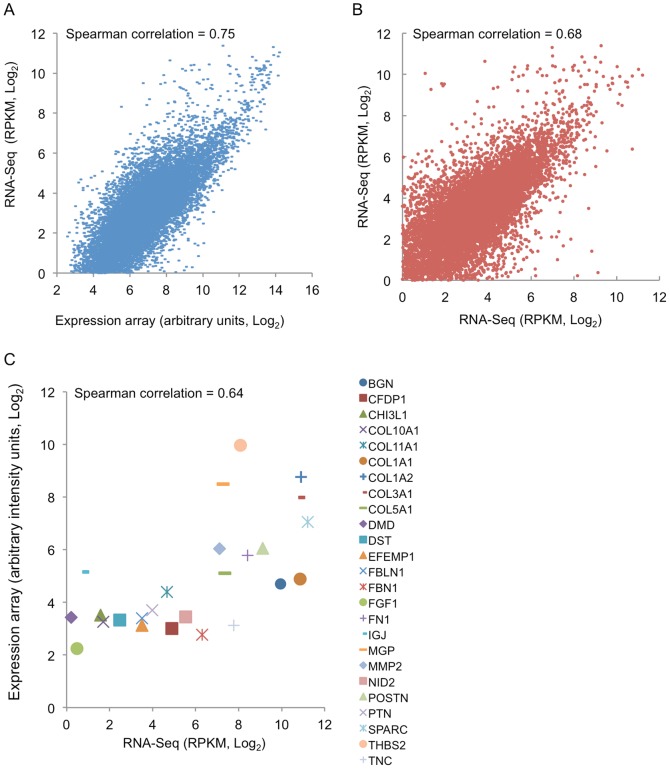
Figure 6. Comprehensive correlation analysis between the RNA-Seq and Affymetrix expression array platforms.
(A) Comparison of gene expression detected by RNA-Seq and Affymetrix expression array platforms for identical SCLC samples (mean, n = 3, P<0.01). (B) Comparison of the gene expression between SCLC primary tumours [34] (Y axis, mean, n = 15) and primary xenografts (X axis, mean, n = 3) (P<0.01). (C) Comparison of gene expression detected by Affymetrix array of micro-dissected human cancer stroma [19] (Y axis, mean, n = 28) and mouse-specific RNA-Seq expression data in the SCLC xenograft models (X axis, mean, n = 3) (P<0.01).

