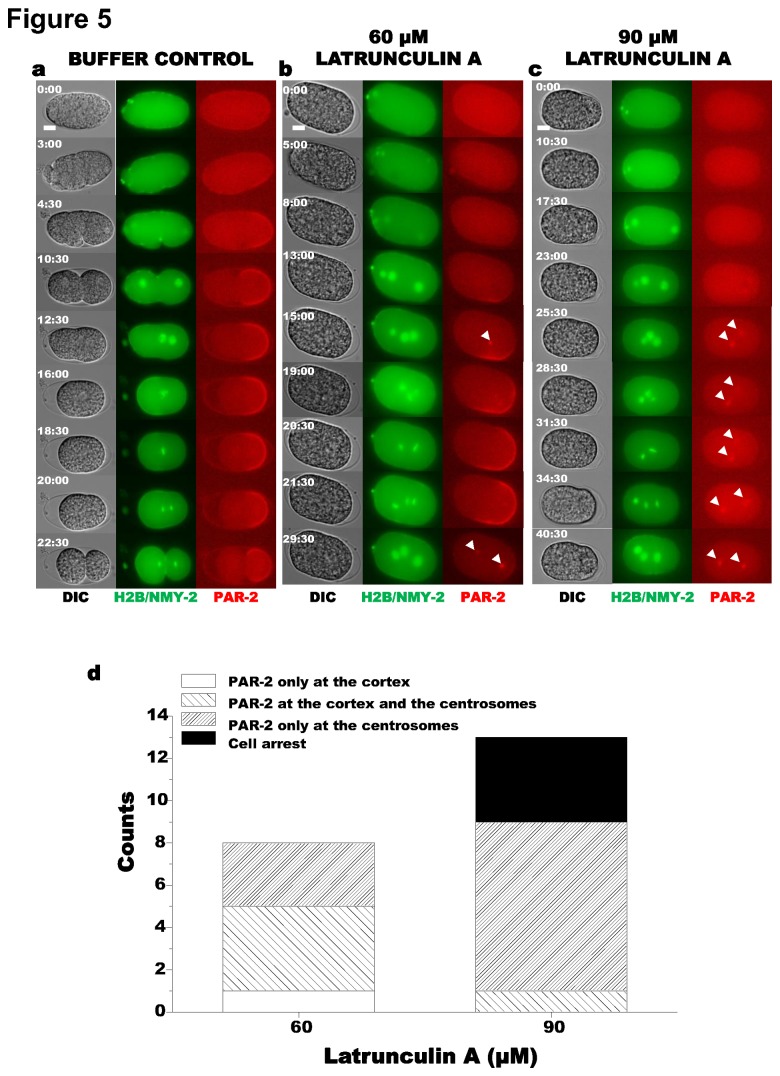
Figure 5. Effect of Latrunculin A concentration on PAR-2 localization.
(a) Control with injection buffer containing 3.75% DMSO in 0.8x EB (N = 10). (b) Injection of 60 µM LatA (N = 8). Shown is an example embryo in which PAR-2 localized at both the cortex and the centrosomes. (c) Injection of 90 µM LatA (N = 13). Shown is an example embryo with PAR-2 localization at the centrosomes only. For each panel, columns from left to right: DIC; NMY2::GFP/GFP::H2B, and mCherry::PAR-2. In some images, only one centrosome is in focus. (d) Distribution of PAR-2 localization phenotypes after injection of 60 µM or 90 µM LatA. In this and all subsequent figures, rows of images are aligned by nuclear dynamics, as assessed by GFP::H2B.

