Figure 3. O2Hb changes.

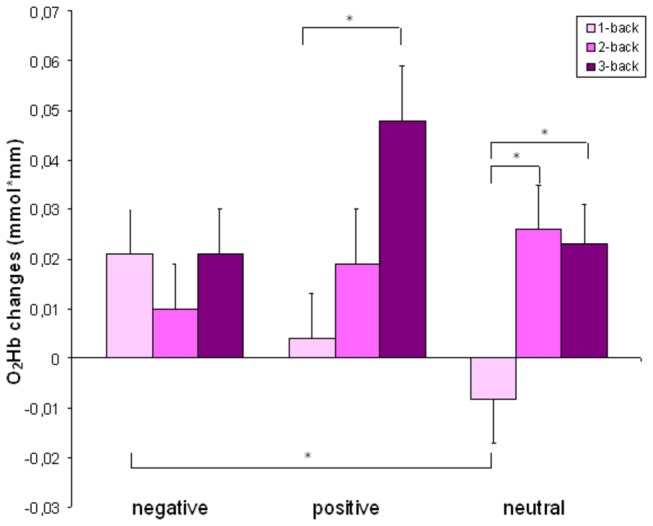
Changes in the oxygenated blood concentration in the ROI. Bars indicate the standard error. * indicates significant differences between difficulty levels (p<0.05).

Changes in the oxygenated blood concentration in the ROI. Bars indicate the standard error. * indicates significant differences between difficulty levels (p<0.05).