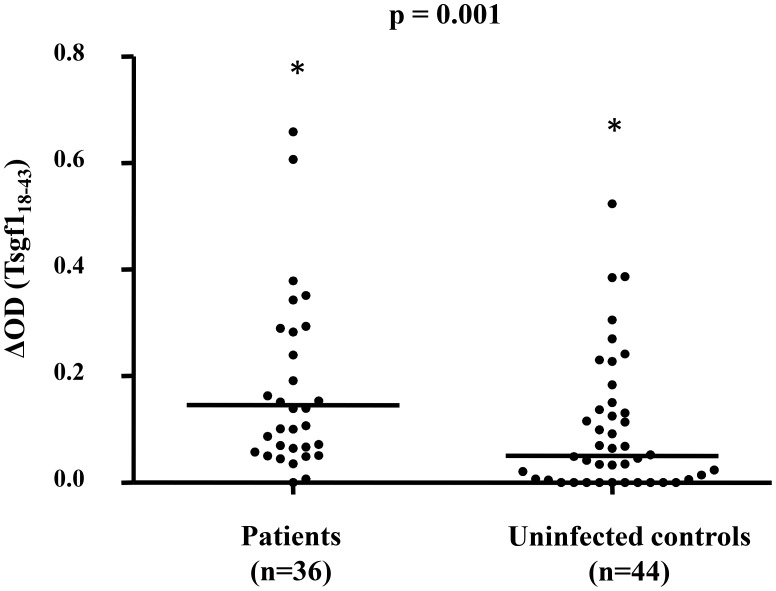
Figure 3. Anti-Tsgf118–43 IgG levels in HAT patients and uninfected controls.
This analysis only includes the plasma samples collected in the Guinean HAT foci. Thirty six samples were from parasitologically confirmed HAT patients and 44 were from uninfected controls from the same villages. The Mann Whitney test was used to compare Tsgf118–43 specific IgG levels between the two groups. The horizontal bars in the graph represent the median of ΔDO values for each group. Asterisks “*” above the dot plots indicate that some values were higher than 0.8 in the patient group (4.11, 3.10, 1.85, 1.21, 1.14) and control group (4.06). The p-value of Mann Whitney U nonparametric test for the comparison between the two groups is given above the plot.

