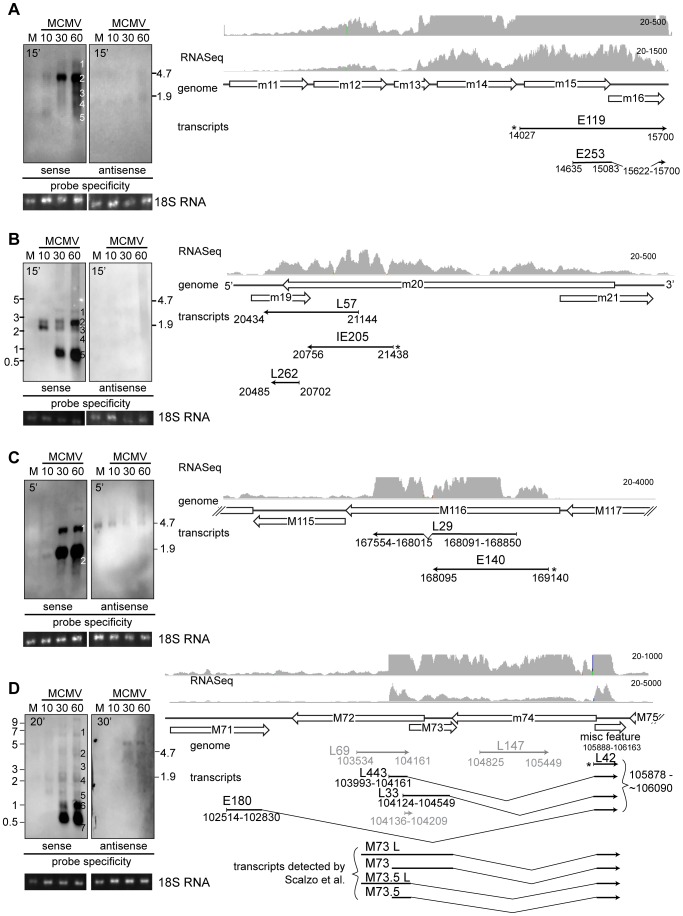
Figure 5. Verification of new transcripts by northern blot.
Balb/c MEF cells were infected with BAC derived Smith virus and harvested at indicated times post infection. Total RNA was separated by denaturing gel electrophoresis, transferred to nylon membrane and incubated with probes specific for S and AS transcripts. RNA integrity and loading was evaluated by inspecting 28S (not shown) and 18S rRNA bands under UV light after transfer to membrane. Transcripts in the m15–16 (A), m19-m20 (B), M116 (C) and M71-m74 (D) gene regions were analyzed (Due to smiling effects during gel electrophoresis for the image shown in 4A and C, the ladder was not accurate for inner lanes of the gel and the position of the ribosomal bands was therefore used to estimate the band sizes). Predicted genes (Rawlinson's annotation) are depicted as empty arrows, while thin black arrows show longest transcripts cloned in our cDNA library as well as clones used to generate probes (marked with *). 3′ ends of transcripts are marked with arrowheads. The nucleotide coordinates relative to Smith sequence (NC_004065.1) of isolated transcripts are given below thin arrows, while the names of the clones are written above. Thin gray lines show isolated transcripts that cannot be detected with the probe. Gray histograms showRNA-Seqreads aligned to MCMV genome. Maximal possible exposure times were used to ensure even low abundance transcripts are detected and are noted on the blots.

