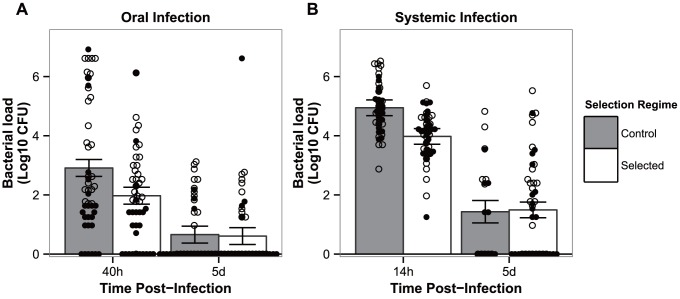
Figure 2. Flies have evolved resistance against P. entomophila infection.
Bacterial loads in flies from both control populations (grey bars) and populations evolving in presence of a pathogen (white bars) when exposed to oral (a) or systemic (b) infection. Males (full diamonds) and females (empty diamonds) are represented separately. Vertical bars correspond to the standard error of the mean pathogen load of each selection regime at each time point. (N = 48, except for panel b) systemic infection on control lines after 5 days where N = 22).

