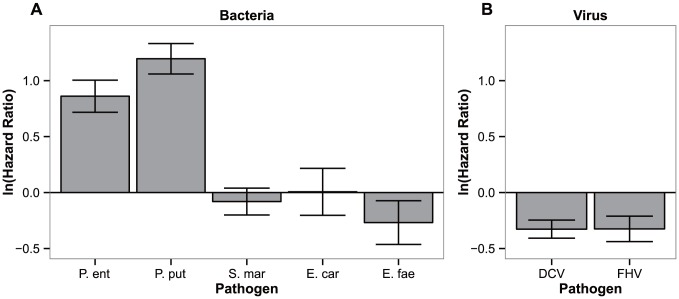
Figure 4. Specificity of the response.
Differences in hazard ratios between control lines (ContSys) and evolved lines with Pseudomonas entomophila systemic infection (BactSys), when exposed to (a) bacterial pathogens, P.e (P. entomophila), P. put (Pseudomonas putida), S.mar (Serratia marcescens), E.fae (Enterococcus faecalis); and (b) viral pathogens, DCV (Drosophila C Virus), FHV (Flock House Virus). Vertical bars correspond to the standard error of the estimated ratio between the selection regime and controls.

