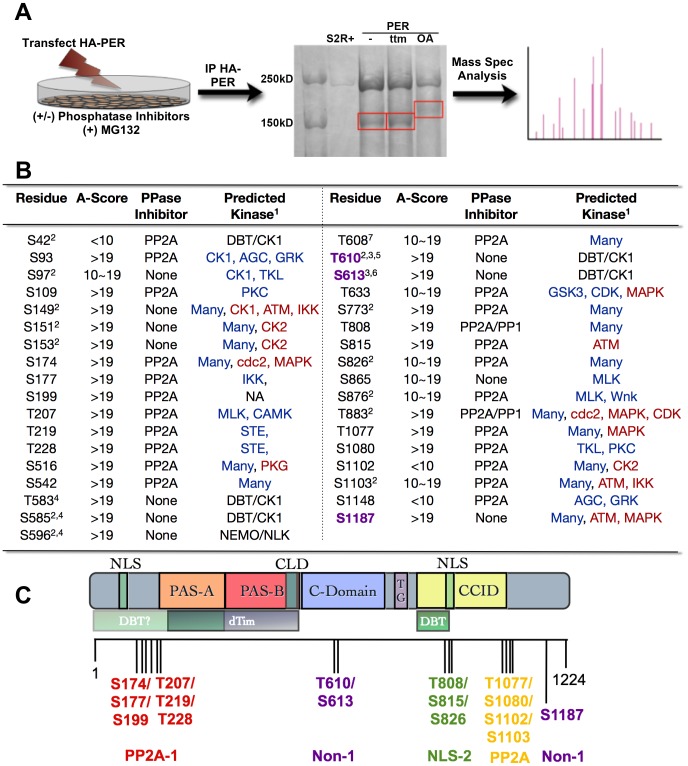
Figure 1. PER phosphorylation sites mapped by mass spectrometry.
(A) Diagram depicting mass spectrometry experimental approach. See Material and Methods for additional details. (B) Table of phosphorylated residues of PER identified in this study. The exact phosphorylation sites are shown as serine (S) or threonine (T) followed by the number of their position in the PER protein sequence (1–1224, Accession #P07663). AScore was determined as described in Beausoleil,S.A. 2006 [29]. In general, phosphorylation sites detected by mass spec with an AScore>19 are almost certain; with 10<AScore<19 are probable; with AScore<10, are detected but uncertain. PPase inhibitor indicates whether a residue is naturally phosphorylated in S2R+ cells (None), or is phosphorylated only when treated with PP1 and/or PP2A inhibitors. 1 = The GPS (blue text; high threshold) and KinasePhos (red text; 100% specificity) online databases were used to predict kinase activity except where noted; 2 = Chiu et al., 2008; 3 = Kivimae et al., 2008; 4 = Chiu et al., 2011; 5 = Additional predictions: KinasePhos = cdc2, MAPK, CDK. Many other kinases were predicted to phosphorylate T610 by GPS; 6 = Additional predictions: GPS = AGC; KinasePhos = MAPK at 90% specificity; 7 = Note, S607 was identified to be a DBT substrate in Kivimae et al., 2008. Abbreviations: MLK = Mixed Lineage Kinase; TKL = Toll Kinase-Like; GRK = GPCR Kinase; AGC = PKA/G/C Kinase Group (C) Schematic representation of PER including functional domains and grouped phosphorylation sites (adapted from [32], with updates from [26], [33]). The nuclear localization signal (NLS), two PER-ARNT-SIM (PAS) domains (PAS-A and PAS-B), the cellular localization domain (CLD), the conserved C-domain, the threonine-glycine (TG) rich region, and dCLK:CYC inhibition domain (CCID) are shown. The shaded boxes below PER indicate regions through which it interacts with other clock proteins: DBT = DOUBLETIME and TIM = TIMELESS. Vertical black lines indicate approximate positions of phosphorylated residues. Red, purple, green, and yellow groups of residues correspond to the transgenic lines used in Figure 3. PP2A-1/2 = Residues phosphorylated only in the presence of the PP2A inhibitor; NLS = Residues located near Nuclear Localization Signal; Non-1 = Naturally phosphorylated residues in presence or absence of phosphatase inhibitors.

