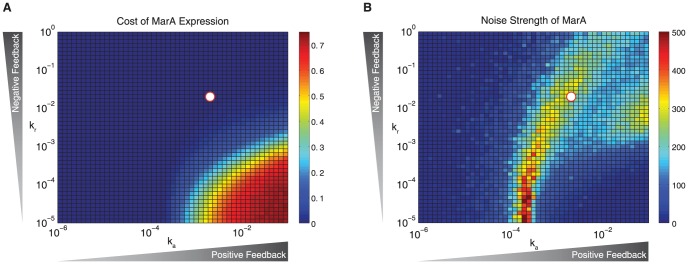
Figure 3. Positive and negative feedback strengths place the system in a low cost, high noise regime.

(A) Cost of MarA expression as a function of the activator and repressor association rates, ka and kr. (B) Noise strength (var/mean) as a function of ka and kr. White circles in (A) and (B) show the nominal Wildtype system parameters. Data show mean values of five replicates.
