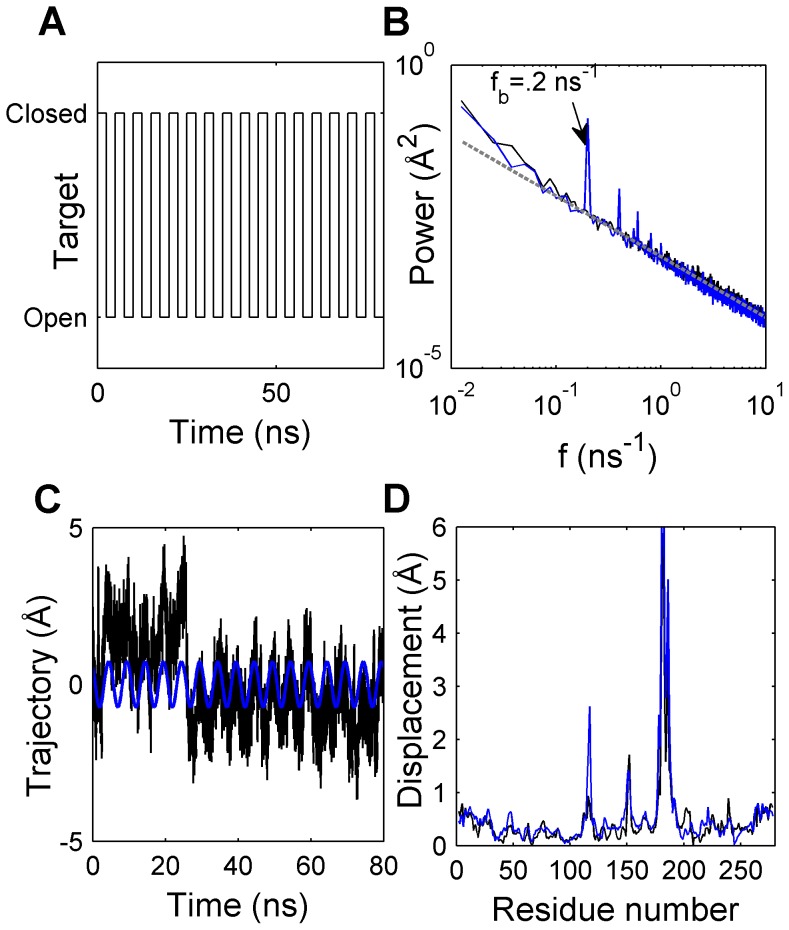
Figure 1. Frequency components of Cα trajectories in EMD and TMD1 simulations.
(A) Time evolution of the target function in TMD1 simulation. (B) Power spectral density per residue (or residue-averaged MSF) for residues 2 to 278. Frequency components of EMD and TMD1 simulations are represented with black and blue solid lines, respectively. Gray dashed lines represent the least-squares lines fit to power spectrum. (C) Reconstructed trajectory of z-Cartesian coordinate of Ser151 Cα atom using power at the base frequency in TMD1 simulation. Raw and reconstructed trajectories are shown in black and blue, respectively. (D) Amplitudes of Cα displacements determined from WPDopen and WPDclosed crystal structures (black) and those estimated using reconstructed in-phase trajectories (blue).

