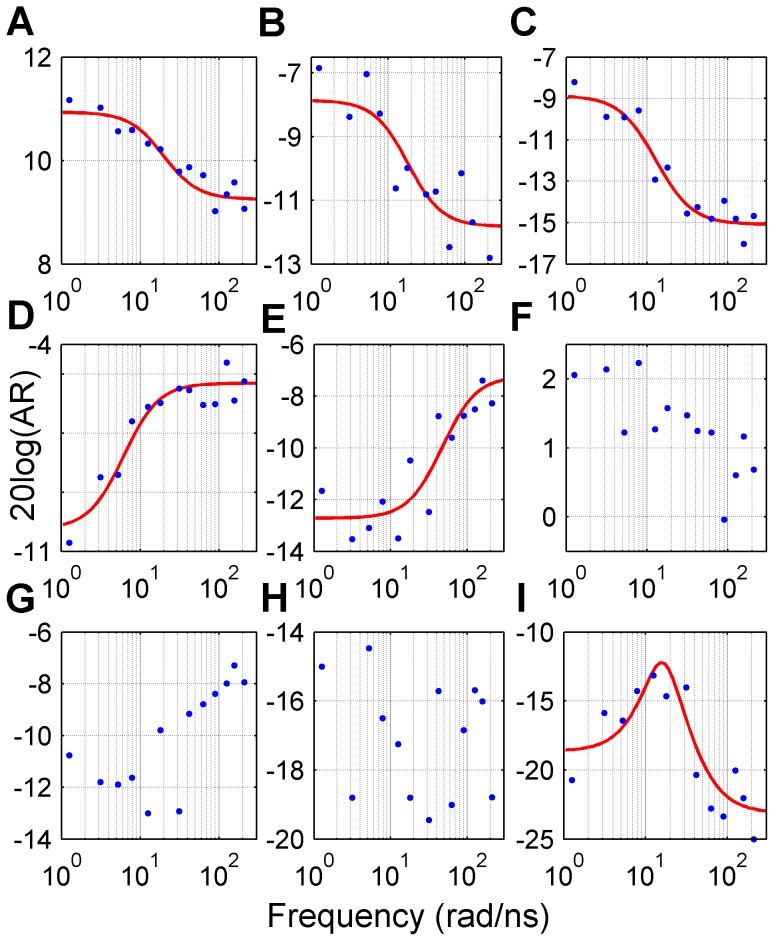
Figure 6. Magnitude Bode plots of Cα atomic displacements.
Fluctuation amplitudes (blue points) of Cα atoms of (A) Asp181, (B) Phe191, (C) Phe269, (D) Lys120, (E) Thr175, (F) Thr178, (G) Tyr176, (H) Pro89 and (I) Cys32 determined at different perturbation frequencies (rad/ns). Red lines represent the fitted lead-lag transfer functions.

