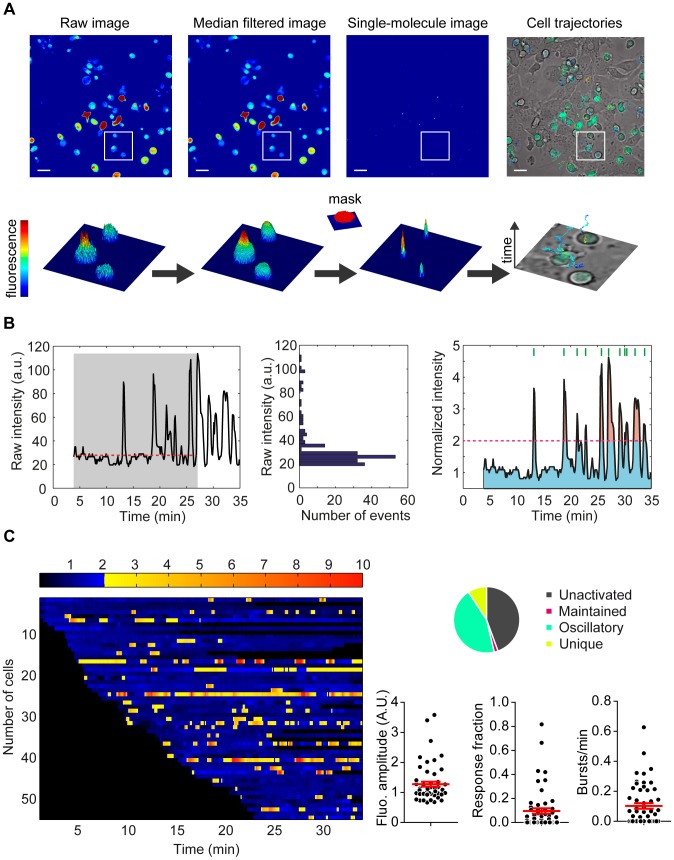
Figure 2. Calcium signal processing. (A) Automatic tracking of high density moving cells by MAAACS.
Raw fluorescence experimental images (displayed with arbitrary pseudo-colors) are first filtered using a median filter to eliminate electronic noise emanating from PMT detection. The filtered image is correlated with a cylindrical mask (depicted next to the central arrow) to detect cells which are represented by Gaussian peaks keeping the overall initial intensities (height). Note that the width of the mask is set to adequately match the average cell width. Cell positions are finally linked from frame to frame following the MTT scheme to obtain trajectories that are color coded according to fluorescence intensity. Scale bar, 20 µm. The lower panel depicts the 2.5D views of the cropped areas. (B) Automatic signal analysis. Raw fluorescence intensities are normalized by taking into account the basal fluorescence enabling comparisons of the calcium signals between cells. The central panel represents the fluorescence intensity distribution before the maximal amplitude (gray area in the left panel). The median value (24.7 in this example, red dotted line in the left panel) is defined as the baseline for the cell. Raw intensities are thus normalized to this value (right panel). The calcium flux in each individual cell can be characterized by several analytical parameters concerned with its intensity (fluorescence amplitude and maximal amplitude) and its shape (response fraction, shown as a ratio of pink and blue areas, and number of bursts/min shown as green lines on the right panel). (C) Graphical representations of the analytical parameters extracted from a movie treated with MAAACS. The global response of cells is represented with a barcode view: the fluorescence amplitude of each cell is plotted along a horizontal line as a function of the time with a color coded intensity (dark to blue below the threshold of activation and yellow to red above the threshold of activation. Threshold of activation is set at 2 here). All analytical parameters (fluorescence amplitude, response fraction and number of bursts/min) extracted from the analysis with MAAACS are plotted in a scatter plot with the mean (+/−SEM, shown in red) and a pie-chart represents the cell response heterogeneity (inactive, maintained, oscillating and unique) (ncells = 55).

