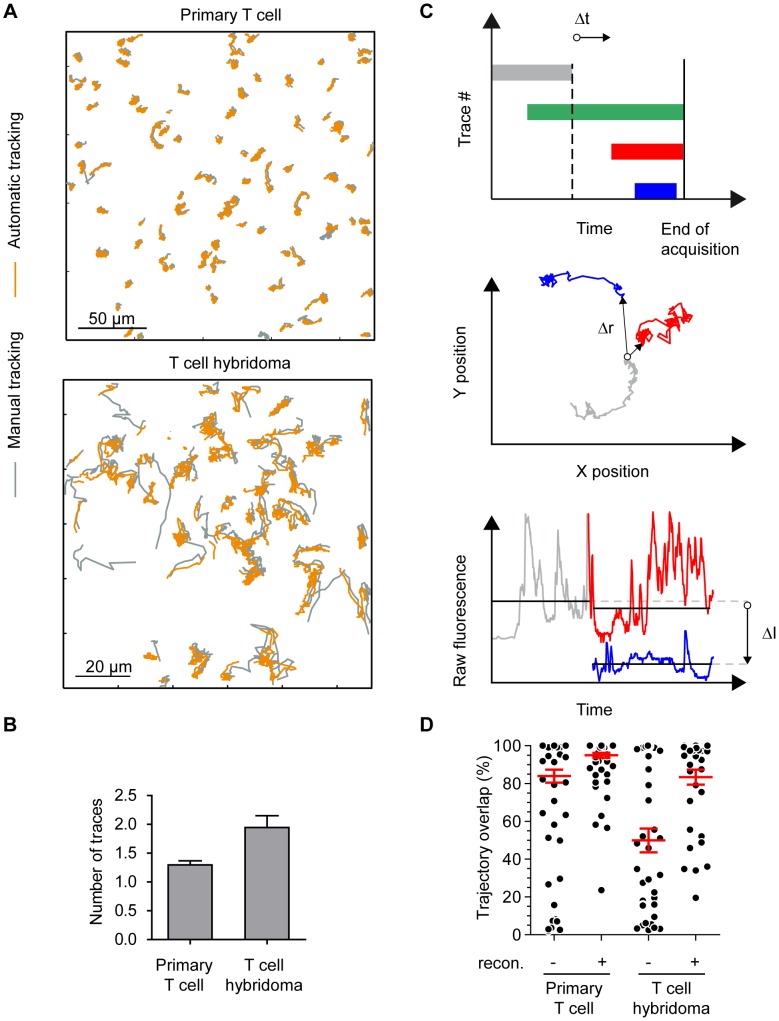
Figure 3. MAAACS tracking performance versus exhaustive manual tracking. (A) Overlay of cell trajectories analyzed manually or with MAAACS.
Traces resulting from manual and automatic tracking (with MAAACS) are plotted together (respectively in orange and gray) to evaluate the tracking efficiency either for primary T cell or T cell hybridomas. (B) Comparison of MAAACS tracking performances versus manual tracking. Left panel - Each trajectory obtained with MAAACS is compared to the corresponding manual trace and the percentage of overlap is represented in a scatter plot for different cell types (primary T cells and T cell hybridomas) with or without reconnection (recon.). Right panel – For each MAAACS trajectory with reconnection, the average number of trace fragments are plotted (+/− SEM). (C) Reconnection algorithm of MAAACS aborted traces. An algorithm was implemented to reconnect trace fragments generated with the automatic tracking. Traces terminating before the end of acquisition (gray trace) were identified by the algorithm. Candidates for reconnection were selected among non-overlapping traces (blue and red traces, but not the green trace, starting before the end of the gray trace) following two additional criteria, narrow distance between traces and similar raw fluorescence amplitudes. The final decision is made using the Graphical User Interface (GUI). (D) Impact of the reconnection on the trajectory overlap between manual tracking and MAAACS. Scatter plot of the percentage of trajectory overlap with or without reconnection supervision calculated for each trace. The average (+/− SEM) are plotted in red.

