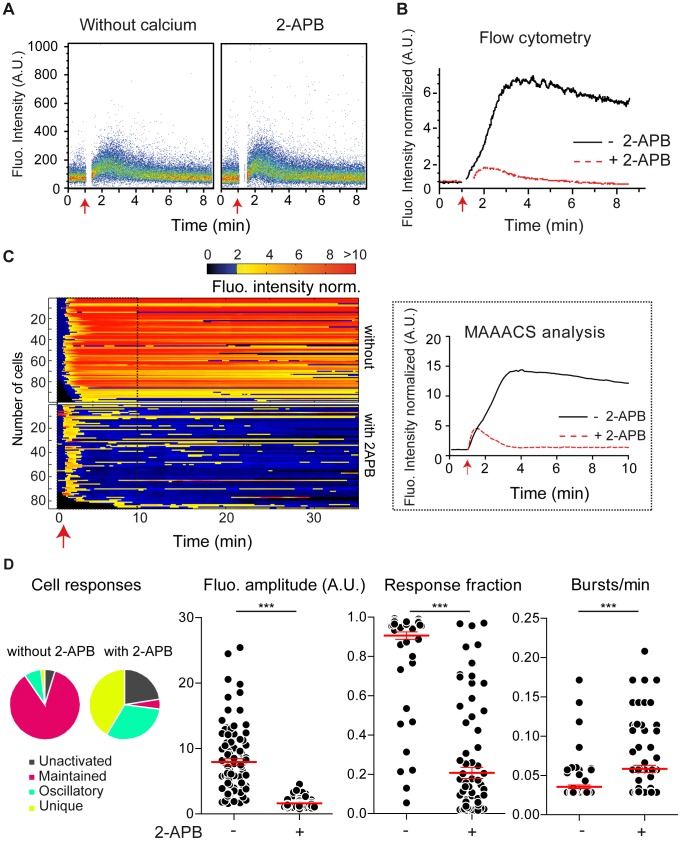
Figure 4. 2-APB induced inhibition of CRAC channel activity prior to thapsigargin stimulation evaluated using flow cytometry as compared to confocal imaging analysis using MAAACS. (A) Intracellular calcium mobilization measured in HBSS without calcium and magnesium or by using the CRAC channel inhibitor 2-APB.
3A9 loaded T cells were resuspended in HBSS Hepes without Ca2+/Mg2+ or in HBSS Hepes with 2-APB before stimulation with thapsigargin (red arrow) and analyzed by flow cytometry. Cell fluorescence is represented on a pseudo-colored dot plot. (B) Global and intracellular calcium mobilization evaluated by flow cytometry. 3A9 loaded cells were stimulated with thapsigargin in the absence (−2-APB) or in the presence (+2-APB) of 2-APB. Evolution of the normalized median of fluorescence of the population is plotted vs. time. (C) Global and intracellular calcium mobilization evaluated by confocal microscopy using MAAACS for detection and analysis. 3A9 loaded cells were stimulated with thapsigargin (red arrow) in the absence (−2-APB) or in the presence (+2-APB) of 2-APB and fluorescence was monitored for 35 min under a confocal microscope. Videos were subjected to MAAACS analysis, and the average fluorescence of the tracked cells is plotted across time (left panel). For better comparison with flow cytometry, images from the first 10 minutes of recording are zoomed in (right panel). (D) Analytical parameters of calcium signaling under thapsigargin stimulation in the absence or presence of 2-APB. The fluorescence amplitude, the response fraction and the number of bursts/min are analyzed as a scatter plot (ncells = 104, −2-APB; ncells = 111, +2-APB). The mean value +/− SEM is represented in red in each condition. Statistical tests were carried out using the Mann Whitney non-parametric test (*** = p<0.001; ** = 0.001<p<0.01; * = 0.01<p<0.05; ns = p>0.).

