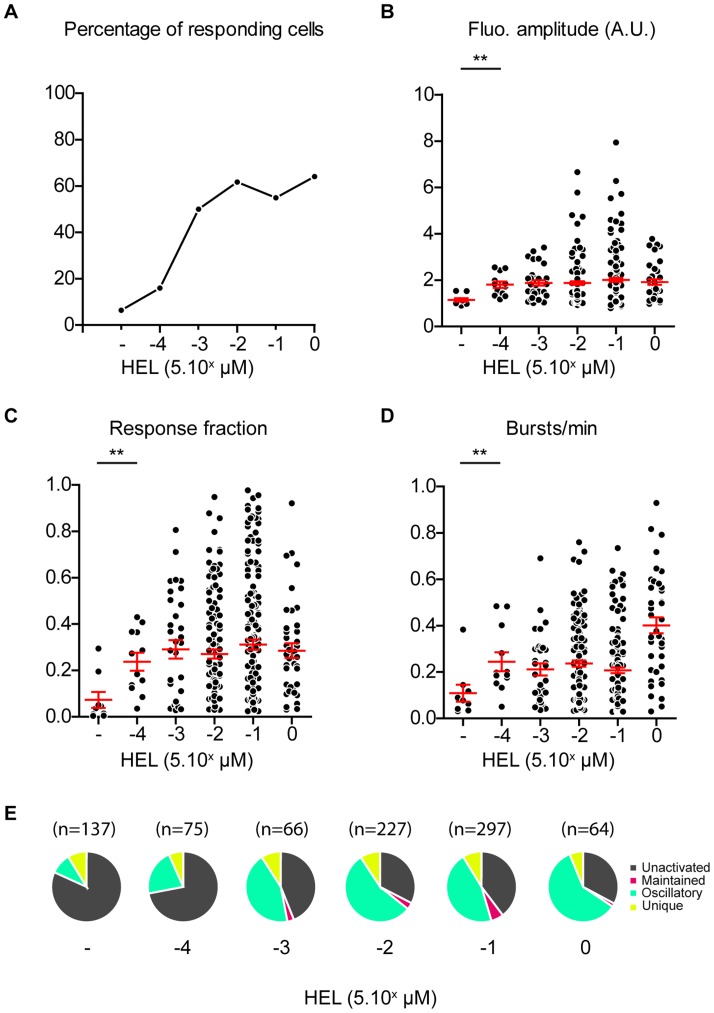
Figure 6. Effect of peptide concentration on the ER release of calcium.
COS-7 cells expressing MHC class II molecules I-AK were loaded overnight with increasing concentrations of HEL 46–61 peptides. Calcium responses in 3A9 hybridomas with 2-APB were analyzed with MAAACS. (A) Percentage of responding cells for various peptide concentrations was obtained with activation thresholds (THact) respectively for hybridomas stimulated with increasing doses of 1.4 (0.5 nM), 1.8 (5 nM), 1.7 (50 nM), 1.6 (500 nM), 1.5 (5 µM) with 2-APB. (B) Fluorescence amplitude of calcium response of activated cells as a function of peptide concentration is represented on a scatter plot. (C) Response fraction of activated cells as a function of peptide concentration is represented on a scatter plot. (D) Frequency calcium response bursts of activated cells as a function of peptide concentration is represented on a scatter plot. The mean value +/− SEM is represented in red. Statistical tests were carried out using Mann Whitney's non-parametric test (*** = p<0.001; ** = 0.001<p<0.01; * = 0.01<p<0.05; ns = p>0.) (E) Mode of calcium response: For each antigenic peptide concentration, modes of calcium response are represented as a pie chart: unactivated in gray, maintained in pink, oscillating in green and unique in yellow.

