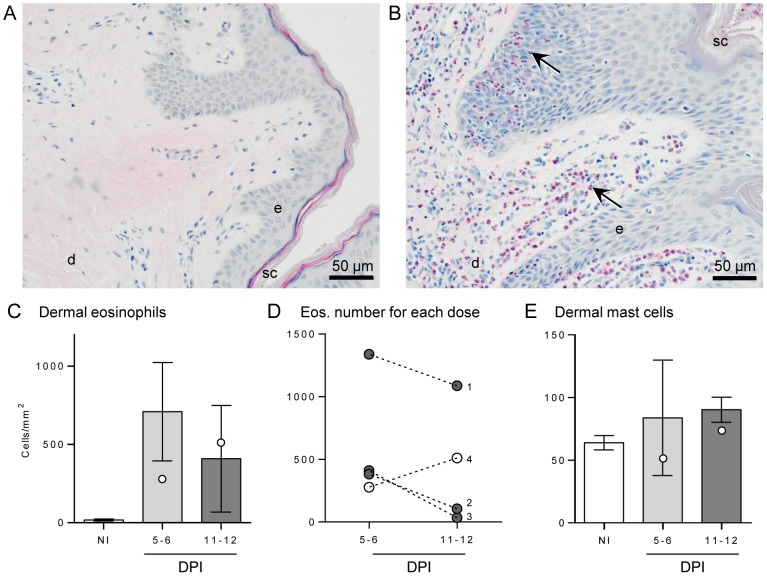
Figure 3. Eosinophil and mast cell numbers of buffalo skin following infection.
Skin sections from a non-infected buffalo (A) and following moderate S. japonicum infection (B) stained with Llewellyn's sirius red stain highlights numerous eosinophils (black arrows) infiltrating the skin layers post-infection. Stratum corneum (sc), epidermis (e) and dermis (d) are indicated for reference. Eosinophils were enumerated in non-infected (NI) and 5–6 or 11–12 days post-infection (DPI) buffaloes (C). Bars represent the mean of the moderate infections with standard error; the two high infections are shown as white dots. The change in eosinophil number over time for each cercarial dose is shown in (D), where buffaloes #4 (white dots) had a high dose (2400) and #1-3 (grey dots) had a moderate dose (200–600), respectively. Numbers of mast cells in the dermis (E) were counted after toluidine blue stain. For each buffalo 7 fields of view at 400× magnification were enumerated and averaged.

