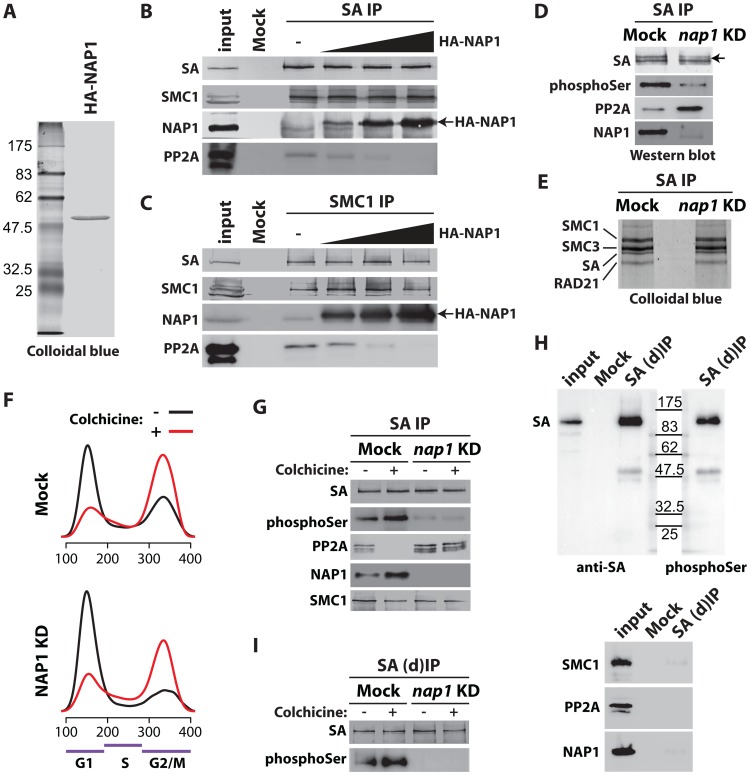
Figure 5. NAP1 regulates SA phoshorylation levels by counteracting PP2A association with chromosomal cohesin during mitosis.
(A) Colloidal blue staining of immunopurified, baculovirus expressed HA-tagged NAP1 from Sf9 cells. (B–C) NAP1 can displace PP2A from cohesin. The endogenous cohesin complex was immunopurified from embryo NE with antibodies against SA (B) or SMC1 (C) as described in Figure 4B–C. Next, increasing amounts of purified HA-NAP1 was added. Following extensive washes the binding of endogenous NAP1, HA-NAP1 and PP2A to the cohesin complex was analyzed by immunoblotting. (D) Western blot analysis of SA IPed from either mock-treated or NAP1 knockdown (KD) cells. Blots were probed with antibodies against SA, phosphorylated serine (phosphoSer), PP2A or NAP1. Note the increased PP2A binding to SA in the absence of NAP1. Concomitantly, SA phosphorylation levels decreased, as revealed by the antibodies against phosphoSer, which recognize a band corresponding to the migration of SA. A slower migrating form of SA, presumably due to phosphorylation, is indicated by an arrow. (E) NAP1 depletion does not affect cohesin complex stability or stoichiometry. In parallel to the immunoblotting in (D), we resolved the IPed SA by SDS-PAGE followed by colloidal blue staining. The identity of the cohesin subunits were determined by mass spectrometric analysis (Figure S5A). (F) Cell cycle profiles of mock-treated (Mock) or NAP1 depleted (KD) S2 cells arrested in mitosis by colhicine (red curves) as compared to asynchronously dividing cells (black curves). Cell cycle profiles were determined by FACS analysis. G1, S and G2/M phases are indicated. (G) PP2A dissociates from cohesin in mitosis, whereas NAP1 binding to SA is increased. Immunoblotting analysis of SA IPed from either mock or NAP1 depleted (KD) cells, treated (+) or untreated (−) with colhicine as in (D). Similar results were obtained for SMC1 IPs from colhicine-treated cells (Figure S6). (H) Immunopurification of SA from S2 cell extracts denatured by 6M Urea ((d)IP) to selectively identify phosphorylated SA with antibodies against phosphorylated serine (phosphoSer). Note that SMC1, NAP1 and PP2A dissociate from SA under these conditions. (I) Western blot analysis of SA IPed under denaturing conditions ((d)IP) from either mock- or NAP1 depleted (KD) cells, which were either treated (+) or untreated (−) with colchicine, confirmed the changes in SA phosphorylation caused by mitotic arrest or NAP1 depletion.

