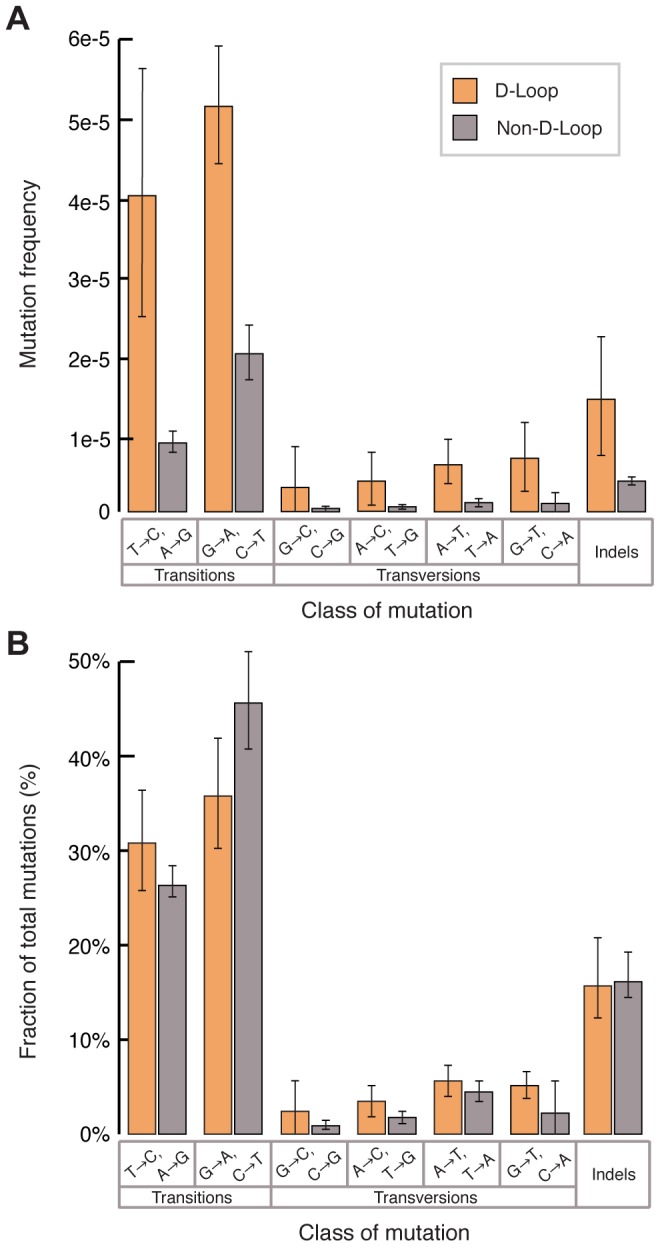
Figure 3. The D-loop has an elevated mutation burden but its mutation spectrum is similar to the remainder of the mitochondrial genome.

(A) The D-loop (orange) exhibits a higher aggregate mutation burden than the rest of the genome (grey). Frequencies were calculated by dividing the number of mutations of each type by the number of times the wild-type base of each mutation type was sequenced. Indels were calculated independently as events per total number of bases sequenced. Error bars represent one standard deviation. (B) The relative fraction of mutations exhibits no difference between the D-loop (orange) and non-D-loop (grey) portions of the genome, suggesting a similar underlying mutagenic process. Error bars represent one standard deviation.
