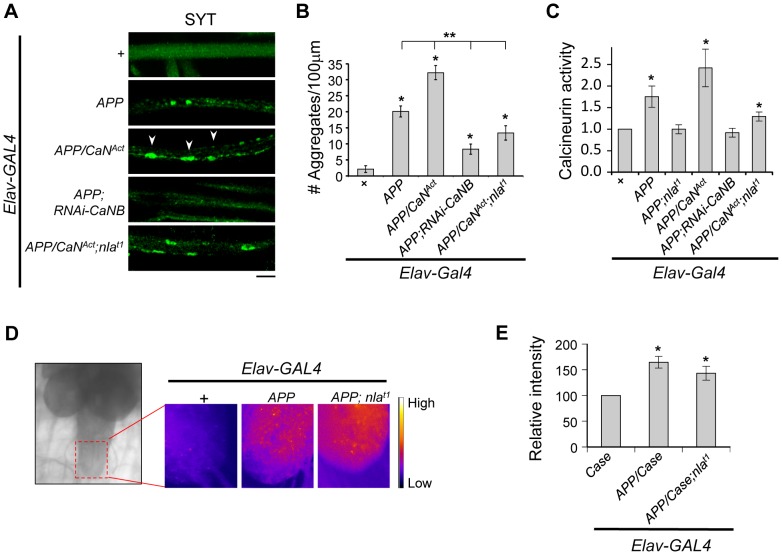
Figure 9. Nebula modulates APP-dependent phenotypes by restoring calcineurin signaling.
(A) Representative images of 3rd instar larval motor axons stained with synaptotagmin. Arrowheads point to examples of aggregates. Scale bar: 10 µm. (B) Quantification of the number of aggregates found in each genotype. (C) Calcineurin activity assay. n≥10 independent experiments per genotype for all experiments. (D) Image of 3rd instar brain highlighting the imaging area (left). Magnified images (right) depict the intensity of the genetically encoded fluorescent calcium sensor, Case12, across genotypes. (E) Quantification of the relative fluorescent intensity across genotypes. n = 6 experiments. All values represent mean ± S.E.M. * p≤0.05 compared to control and ** P<0.05 compared to the indicated genotypes.

