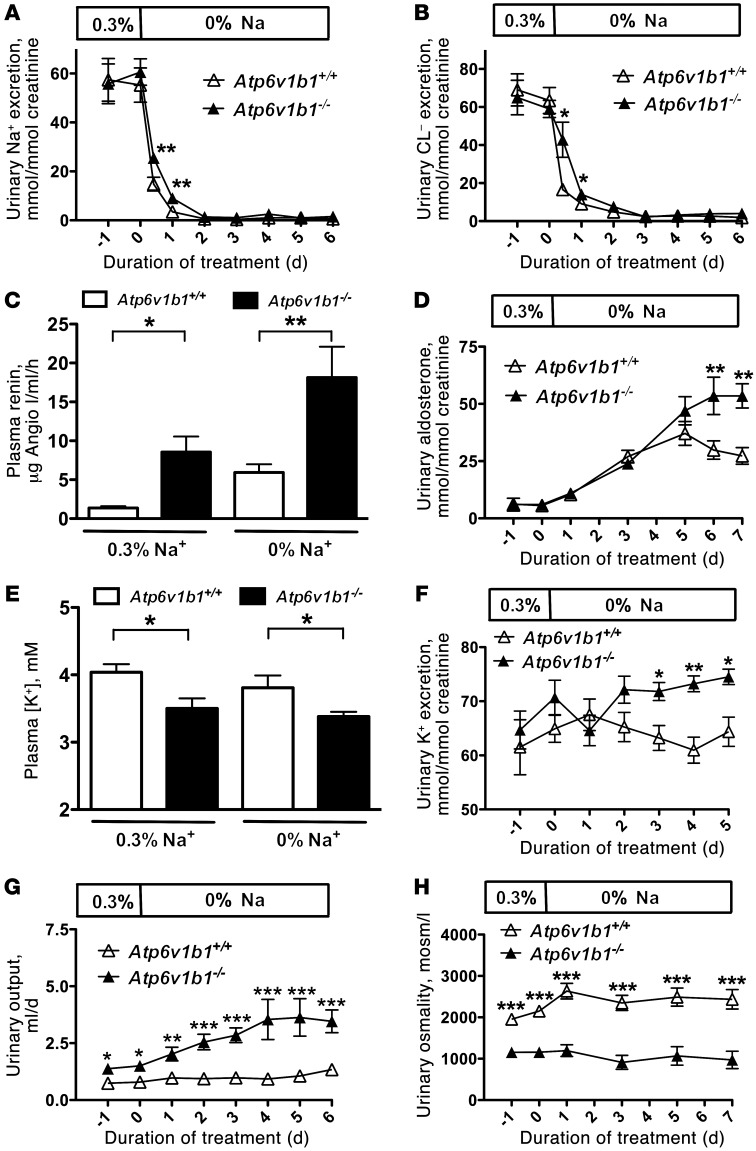
Figure 1. Effects of dietary NaCl restriction and renal K+ and water handling in Atp6v1b1–/– mice.
(A) Time course of renal excretion of Na+ in Atp6v1b1–/– and Atp6v1b1+/+ mice fed a normal-salt diet and then switched to a NaCl-restricted diet. (B) Time course of renal Cl– excretion. (C) Plasma renin concentration was measured on a normal-salt diet and after 6 days of NaCl restriction. (D) Time course of urinary excretion of aldosterone. (E) Plasma [K+] was measured in Atp6v1b1–/– and Atp6v1b1+/+ mice fed a normal-salt diet or after 6 days of NaCl restriction. (F) Time course of renal K+ excretion when animals used for measurements of plasma [K+] shown in E were switched from normal to NaCl-restricted diet. (G) Time course of urine output. (H) Time course of urine osmolality. Data are presented as means ± SEM; n = 8 for Atp6v1b1+/+ and n = 7 for Atp6v1b1–/–. Statistical significance was assessed using an unpaired Student’s t test. *P < 0.05, **P < 0.01, and ***P < 0.001 vs. Atp6v1b1+/+.

