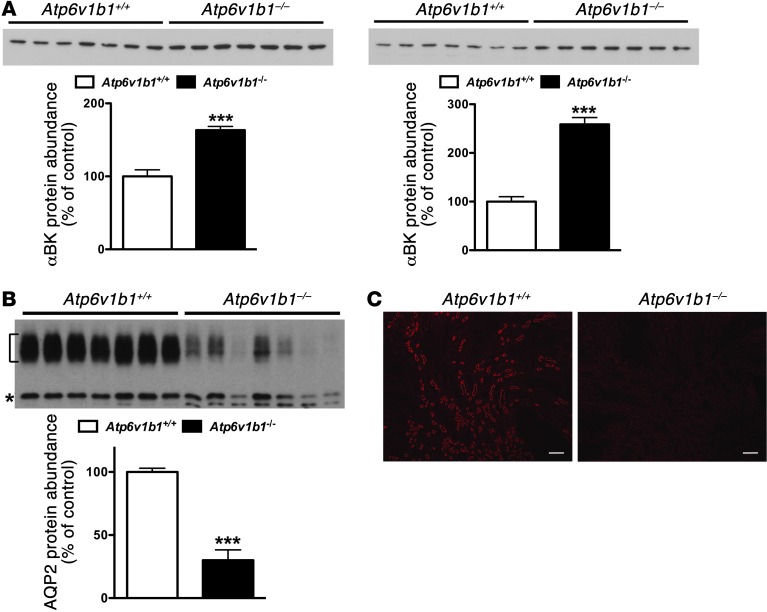
Figure 3. BKCa and AQP2 protein expression assessed in Atp6v1b1–/– and Atp6v1b1+/+ mice.
(A) Western blot for α-BKCa on renal cortex (left) or renal medulla (right). Each lane was loaded with a protein sample from a different mouse; 15 μg and 5 μg proteins were loaded per gel lane for cortical samples and medullary samples, respectively. (B) Western blot for AQP2 on renal medulla. Bracket and asterisk show the glycosylated 37-kDa and the unglycosylated 25-kDa forms of AQP2, respectively. Each lane was loaded with a protein sample from a different mouse; 5 μg proteins were loaded per gel lane. Equal loading was confirmed by parallel Coomassie-stained gels. Bar graphs summarize densitometric analyses. For AQP2, bar graphs summarize bracketed and asterisked bands. ***P < 0.01 vs. Atp6v1b1+/+, unpaired Student’s t test. (C) Immunohistochemistry of kidney sections showing AQP2 staining in renal medulla from Atp6v1b1+/+ and Atp6v1b1–/– mice. Scale bars: 250 μm.

