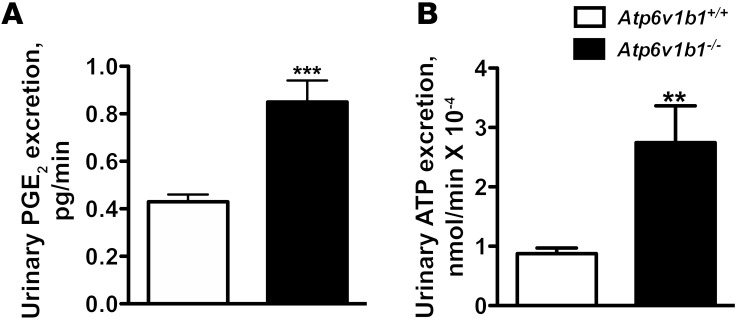
Figure 4. Effects of Atp6v1b1 disruption on urine excretion of PGE2 and ATP.
(A and B) Urinary excretion of PGE2 (A) and ATP (B) in Atp6v1b1–/– and Atp6v1b1+/+ mice. Data are means ± SEM. For PGE2, n = 26–27 mice in each group. For ATP, n = 15 mice in each group. **P < 0.01 vs. Atp6v1b1+/+; ***P < 0.001 vs. Atp6v1b1+/+, unpaired Student’s t test with Welch’s correction.

