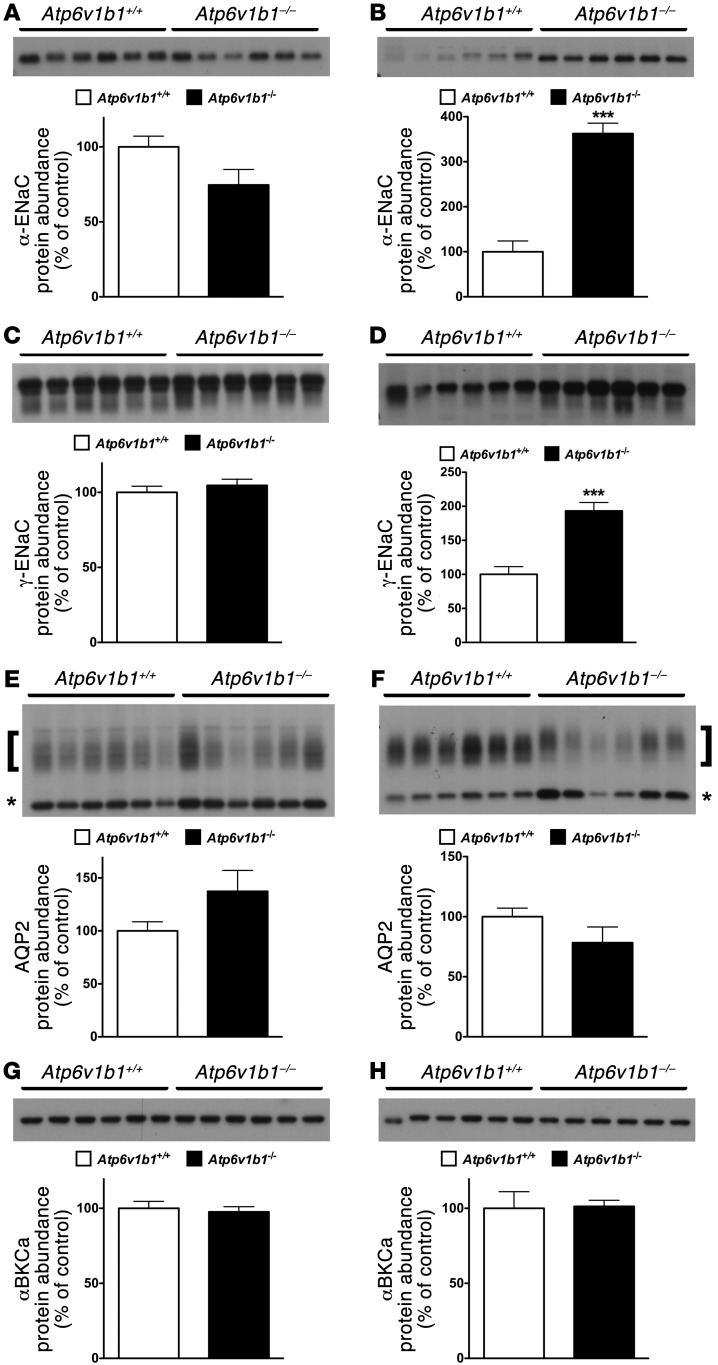
Figure 5. Effects of 2 days of indomethacin injection on the protein abundance of ENaC, AQP2, and BKCa in Atp6v1b1–/– and Atp6v1b1+/+ mice.
(A–H) Protein abundance of α-ENaC subunit (A and B), γ-ENaC subunit (C and D), AQP2 (E and F), and α-BKCa (G and H) was assessed with Western blot analysis of protein extracted from renal cortex (A, C, E, and G) or medulla (B, D, F, and H) of Atp6v1b1–/– and Atp6v1b1+/+ mice after 2 days of indomethacin injections. Each lane was loaded with a protein sample from a different mouse; 15 μg and 5 μg proteins were loaded per gel lane for cortical samples and medullary samples, respectively. Equal loading was confirmed with parallel Coomassie-stained gels. Bar graphs summarize densitometric analyses. ***P < 0.001 vs. Atp6v1b1+/+. In A and B, arrow indicates the 90-kDa–specific band for α-ENaC. In E and F, bar graphs summarize bands indicated by brackets (glycosylated 37-kDa form of AQP2) and asterisks (unglycosylated 25-kDa form of AQP2).

