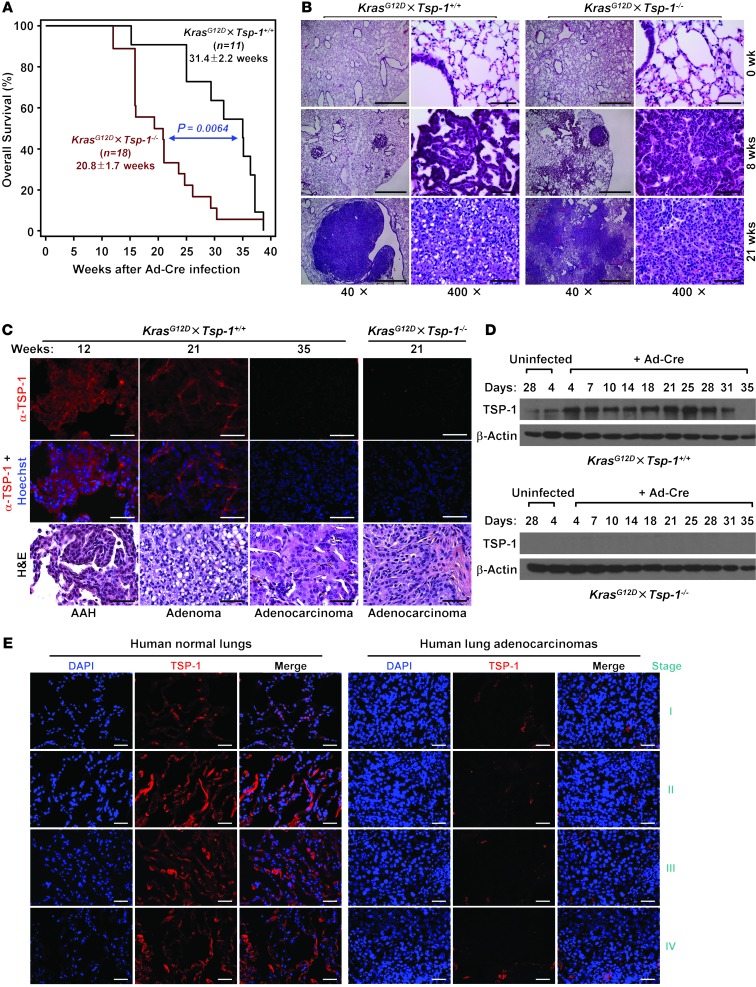
Figure 1. Loss of TSP-1 leads to decreased survival and rapid progression of KrasG12D-mediated lung tumorigenesis.
(A) Overall KrasG12D×Tsp-1+/+ and KrasG12D×Tsp-1–/– mouse survival after induction of KrasG12D expression via intranasal instillation of Ad-Cre. Data represent mean ± SEM. P = 0.0064. (B) H&E images of lungs at the indicated times after oncogenic Kras activation. Lungs were harvested, stained with H&E, and scored for tumor pathology. (C) TSP-1 expression in oncogenic KrasG12D-driven lung lesions at the indicated times after Ad-Cre infection. Isolated KrasG12D×Tsp-1+/+ lungs were examined for TSP-1 expression by immunofluorescence. KrasG12D×Tsp-1–/– lung tumors were immunostained for TSP-1 as a negative control. Corresponding H&E images of tumors are shown below. AAH, atypical adenomatous hyperplasia. (D) Time course analysis of TSP-1 expression upon oncogenic Kras activation in primary murine adult lung fibroblasts. KrasG12D×Tsp-1+/+ lung fibroblasts were infected with Ad-Cre, harvested at the indicated time points, and analyzed for TSP-1 expression by immunoblotting. KrasG12D×Tsp-1–/– fibroblasts served as a negative control. (E) Representative images of TSP-1 expression by immunofluorescence in normal human lungs and lung adenocarcinomas at different stages. Scale bars: 1 mm (B, ×40); 50 μm (B, ×400; C; and E).

