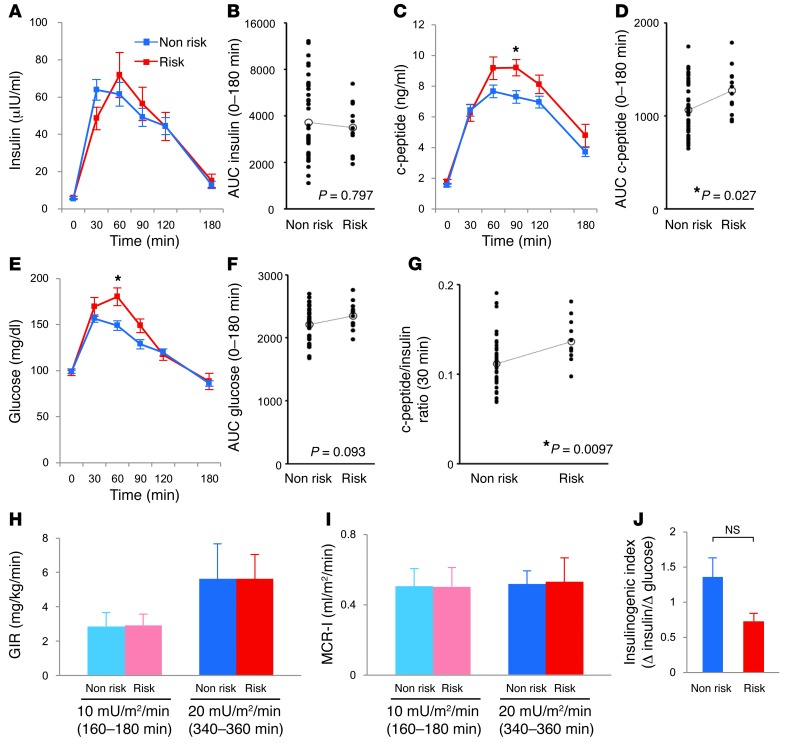
Figure 4. Increased insulin clearance in humans with the risk allele of SLC30A8.
(A–F) Concentration (A, C, and E) and AUC 0–180 minutes (B, D, and F) of insulin (A and B), c-peptide (C and D), and glucose (E and F) during 75-g oral GTT in human nonrisk (n = 42) and risk (n = 12) allele groups. (G) c-peptide/insulin ratio at 30 minutes of human 75-g oral GTT. (H) GIR during glucose clamp at each insulin infusion rate. (I) MCR-I at steady state during the infusion of exogenous insulin at 10 or 20 mU/m2/min. (J) Insulinogenic index, calculated as change in insulin (0–30 minutes) relative to change in glucose (0–30 minutes). Data are mean ± SEM (A, C, E, and J) or mean ± SD (H and I). *P < 0.05, unpaired t test.

