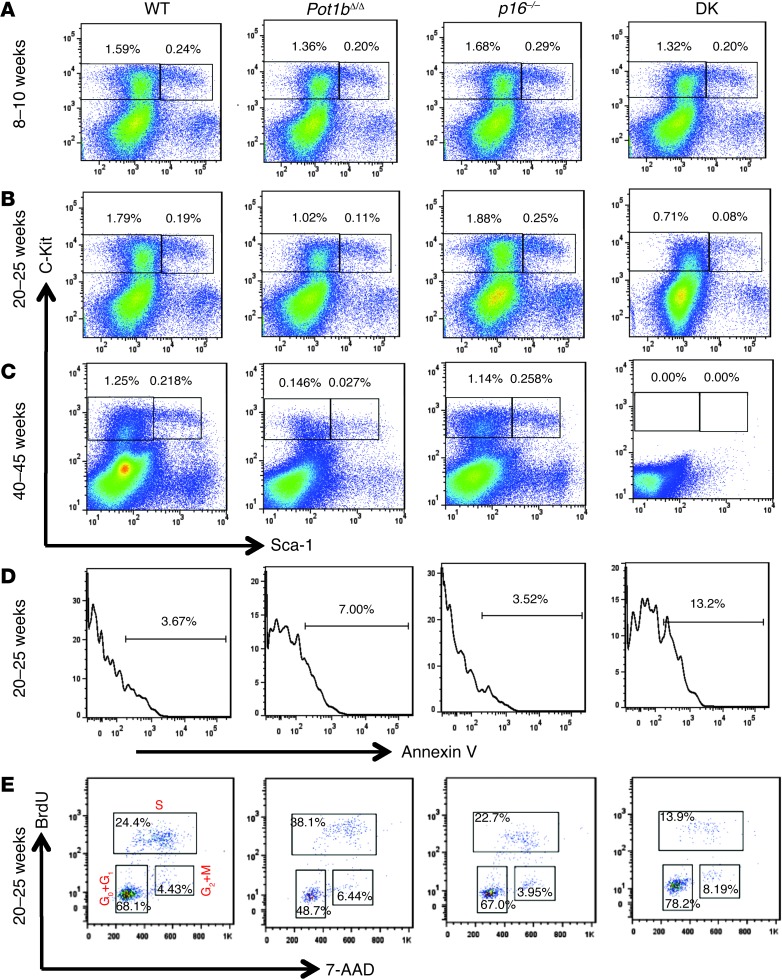
Figure 3. Increased loss of BM cells in aging Pot1bΔ/Δ;p16–/– mice.
Representative FACS analysis of multilineage-negative cell populations derived from the BM of mice of the indicated genotypes at 8 to 10 weeks of age (A), 20 to 25 weeks of age (B), and 40 to 45 weeks of age (C). Numbers are the percentage of LSK and LK cells in total BM. Each genotype comprises a minimum of 4 mice. (D) Representative histograms showing annexin V profiles of LSK cells isolated from the BM of 20- to 25-week-old mice of the indicated genotypes. Each genotype includes cells from a minimum of 3 mice. (E) Cell cycle status of 20- to 25-week-old BrdU-labeled mouse LSK cells. A representative FACS plot from experiments with at least 3 mice of each indicated genotype is shown.

