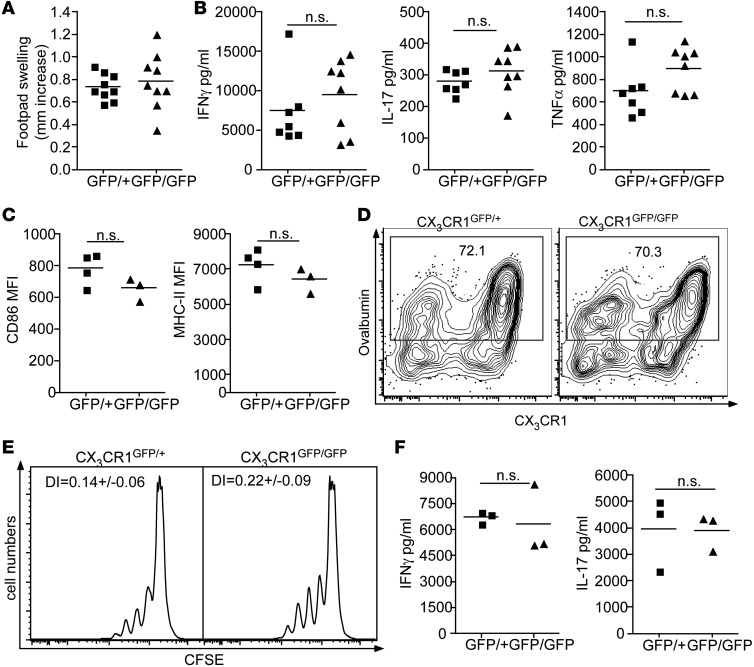
Figure 5. Cell-intrinsic DC functions are unaltered by CX3CR1 deficiency.
(A) DTH reaction in the skin of CX3CR1GFP/+ reporter mice and CX3CR1GFP/GFP-deficient mice, rechallenged by footpad injection with NTS. Depicted is footpad swelling in comparison with the contralateral footpad injected with vehicle control. (B) IFN-γ, IL-17, and TNF concentration in the supernatant of 24-hour splenocyte culture from nephritic CX3CR1GFP/+ and CX3CR1GFP/GFP mice rechallenged with NTS. 107 total splenocytes were cultured for 24 hours in 1 ml medium and 1:200 NTS. (C) MFI of CD86 and MHC-II expression on kidney DCs from CX3CR1GFP/+ mice and CX3CR1GFP/GFP mice, determined by flow cytometry. (D) Representative FACS plots of the in vivo uptake of fluorescently labeled OVA by kidney DCs of nephritic CX3CR1GFP/+ and CX3CR1GFP/GFP mice gated on CD45+MHC-II+CD11c+ cells. Numbers show percentages of OVA+ DCs. (E) Representative histograms of T cell proliferation and CFSE dilution and division indices (DI) in a coculture of OVA-specific T cells and kidney DCs from nephritic CX3CR1GFP/+ and CX3CR1GFP/GFP mice injected with 1 mg OVA 1 hour prior to cull. (F) IFN-γ and IL-17 concentrations in supernatants of 72-hour cocultures from E. Data points represent individual mice, and results are representative of 2 to 4 experiments, with 3 to 4 mice per group. Statistical significance was tested with the unpaired Student’s t test.

