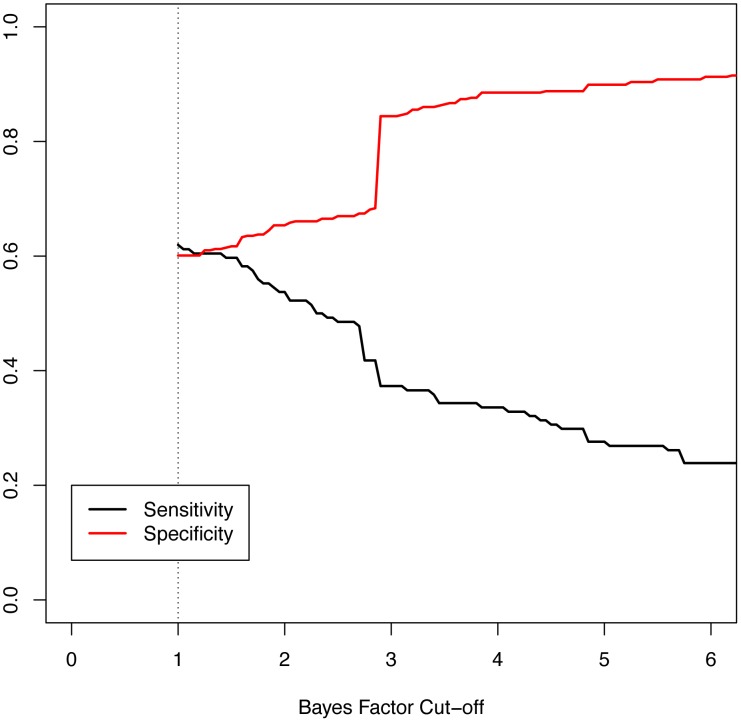
Figure 7. Measures of performance of the Bayes factor to discriminate epilepsy phenotype.
The graphic shows the sensitivity and specificity of the Bayes factor to identify patients with epilepsy versus those referred for non-neurologic indications. The sensitivity, or the probability of having a positive test given the phenotype, is shown in black. The specificity, or the probability of a negative test given no phenotype, is shown in red. The minimum Bayes factor for a gene or patient is 1 by definition (dotted line).

