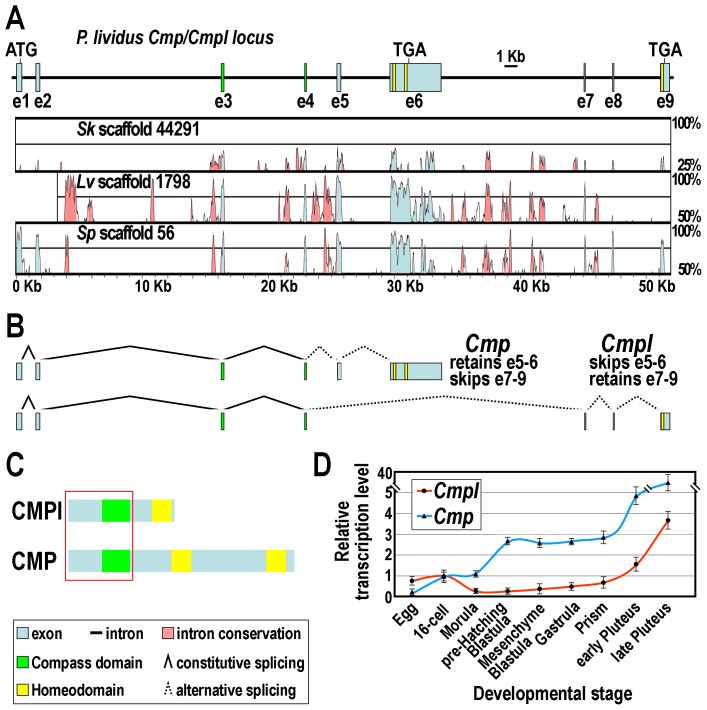
Figure 2. The Cmp/Cmpl locus and its products.
(A) Schematic drawing of the Cmp/Cmpl gene structure showing the positions of exons. Phylogenetic footprinting analysis is shown beneath the diagram. (B) Structure of the alternatively spliced mRNAs. (C) Diagrammatic representation of the CMPl and CMP protein domain organization. Red square indicates common amino acidic sequence at the N-terminal side. (D) qRT-PCR analysis of Cmpl and Cmp transcripts throughout P. lividus embryogenesis. Values at the various stages are shown as fold difference with respect to the 16-cell stage, which displays roughly equal amount of Cmpl and Cmp mRNAs. Bars are standard errors for the qPCR replicas.

