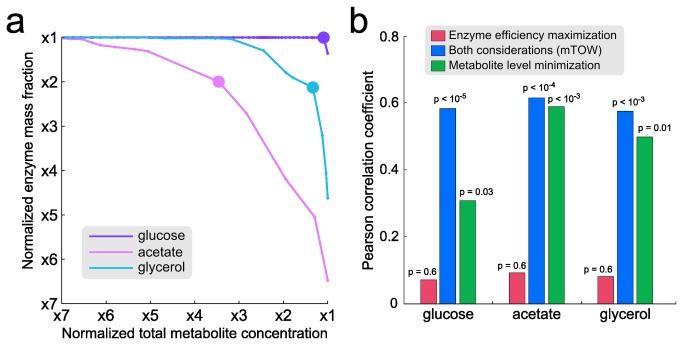
Figure 2. The contribution of the two optimization factors, minimization of metabolite load and maximization of enzyme efficiency, to the successful prediction of metabolite concentrations.
(a) Pareto-optimal solutions predicted by mTOW for E. coli grown under glucose, acetate and glycerol media. Axes values are normalized to minimal values, where 1 represents the minimum, and the rest of the values represent the deviations (in fold change) from those minimal values. (b) The correlation between mTOW’s predicted and measured metabolite concentrations when considering either one of the optimization factors or both of them together.

