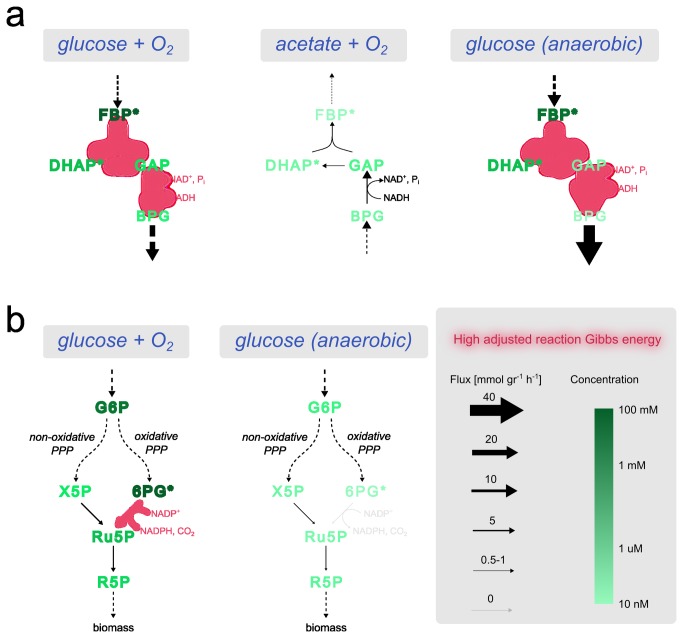
Figure 4. mTOW predictions of metabolite concentrations in glycolysis and pentose phosphate pathway are in accordance with experimental data.
Reactions with high adjusted Gibbs energies (above 5.7 kJ/mol) are marked in red, and measured metabolites are marked with an asterisk. (a) On glucose media mTOW predicts a gradual decrease in metabolite concentrations across a distributed thermodynamic bottleneck from FBP to BPG (as supported by the measurements of FBP and DHAP) in both aerobic and anaerobic conditions. In aerobic acetate medium, the reversal of the glycolytic flux direction eliminates the thermodynamic bottleneck and leads to the prediction of markedly lower concentrations for FBP and DHAP in accordance with experimental data. (b) mTOW correctly predicts a marked decrease in concentration of 6PG in glucose media under anaerobic versus aerobic glucose conditions, due to thermodynamic considerations involving the decrease in flux through phosphogluconate dehydrogenase (that metabolite 6PG to Ru5P) in anaerobic conditions. Metabolite abbreviations presented in the figure: FBP-D-fructose 1,6-bisphosphate, DHAP - dihydroxyacetone phosphate, GAP-D-glyceraldehyde 3-phosphate, BPG-D-glycerate 1,3-bisphosphate, PPP - Pentose Phosphate Pathway, G6P - D-glucose 6-phosphate, X5P - D-xylulose 5-phosphate, 6PG - D-gluconate 6-phosphate, Ru5P - D-ribulose 5-phosphate, R5P - D-ribose 5-phosphate.

