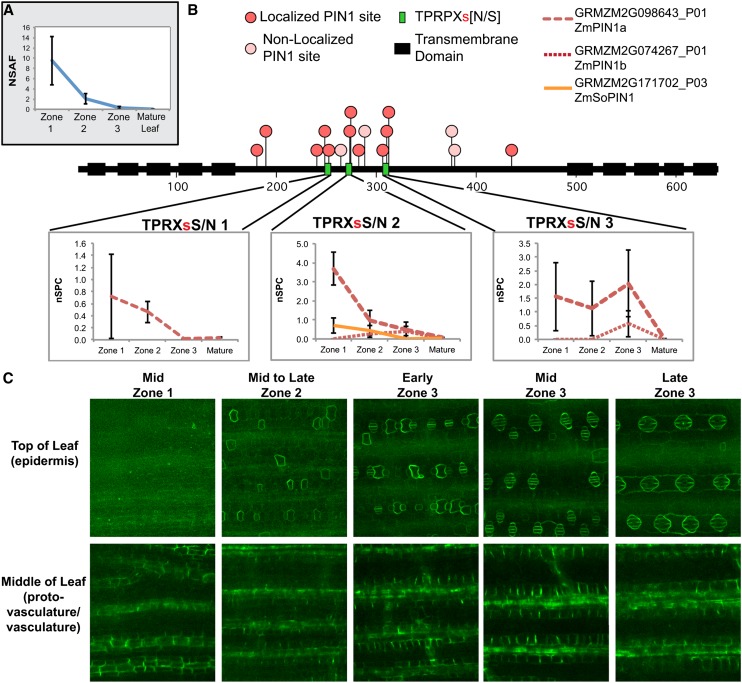
Figure 7.
PIN1 Expression Is Highest in Zone 1, but a Ser Residue Is Differentially Phosphorylated in Zone 3.
(A) NSAF scores of PIN1 indicate highest expression is in zone 1. The NSAF score shown is for the group leader GRMZM2G098643_P01 but may also include peptides from PIN1b, and PIN1c.
(B) PIN phosphorylation sites marked by red dots in a consensus sequence of PIN1a, PIN1b, PIN1c, and SoPIN1. All phosphopeptides containing the phosphorylated Ser highlighted in red from the TPRXsS/N were summed together for each of the four PIN proteins and are graphed below their respective sites. The peptides and their SPCs are individually listed in Supplemental Data Set 6 online.
(C) Expression of PIN1a-YFP is strongest in the vasculature in all three zones (bottom panels) but also appears in the epidermis in zone 3 where it changes cell-type expression and localization (top panels).

