Figure 1.
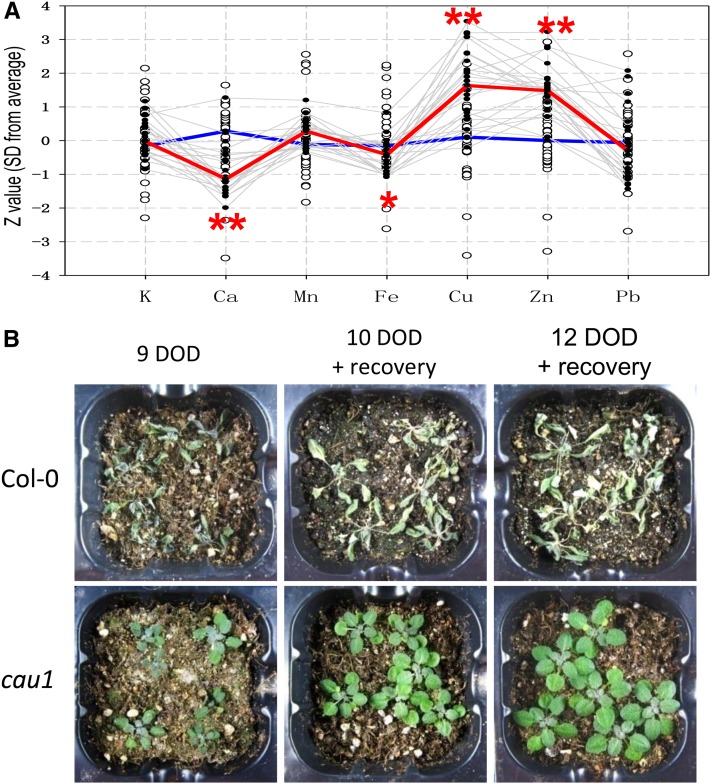
The Calcium Underaccumulation Mutant cau1 with Enhanced Drought Tolerance.
(A) Ion accumulation profile of cau1. Seven cationic elements in cau1 M3 mutant plants were measured by ICP-MS. Open black circles represent Z values (sd from the average value of the wild type control, y axis) of the individual wild-type controls, and gray lines highlight the ion profile data of cau1 mutants. Median Z values of the wild type (n > 30) and cau1 mutants (n > 30) were calculated, and the resultant ion profiles were outlined by the blue line and red line, respectively.
(B) Wild-type and cau1 mutant plants subjected to drought stress for 9 to 12 d. Plants were exposed to 9 d of drought (DOD) treatment or treated for 10 or 12 d and subsequently reirrigated and allowed to recover for 1 week. *P < 0.05 and **P < 0.01.

