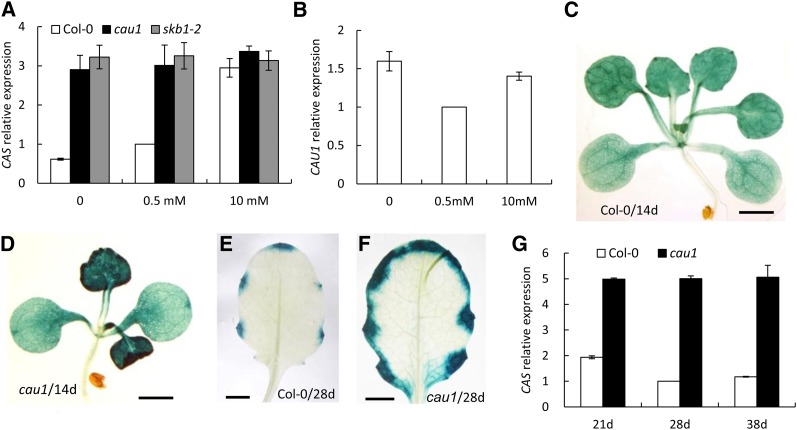
Figure 3.
CAS Expression Is Enhanced in cau1 Plants.
(A) and (B) Three-week-old plants grown hydroponically were treated with 0, 0.5, and 10 mM Ca2+ for 4 d. The expression levels of CAS (A) or CAU1 (B) in shoots were determined by RT-PCR. Actin2 was used as an internal control. Values are mean ± se, n = 3.
(C) to (F) Histochemical localization of GUS driven by the CAS promoter in 14-d-old wild-type (C) and cau1 mutant seedlings (D) or 28-d-old wild-type (E) and cau1 leaves (F). Bars = 0.25 cm.
(G) CAS expression in wild-type and cau1 plants grown in soil to the indicated ages.

