Figure 5.
CAU1 Regulates Guard Cell [Ca2+]o Signaling and Ca2+ Starvation Tolerance via CAS.
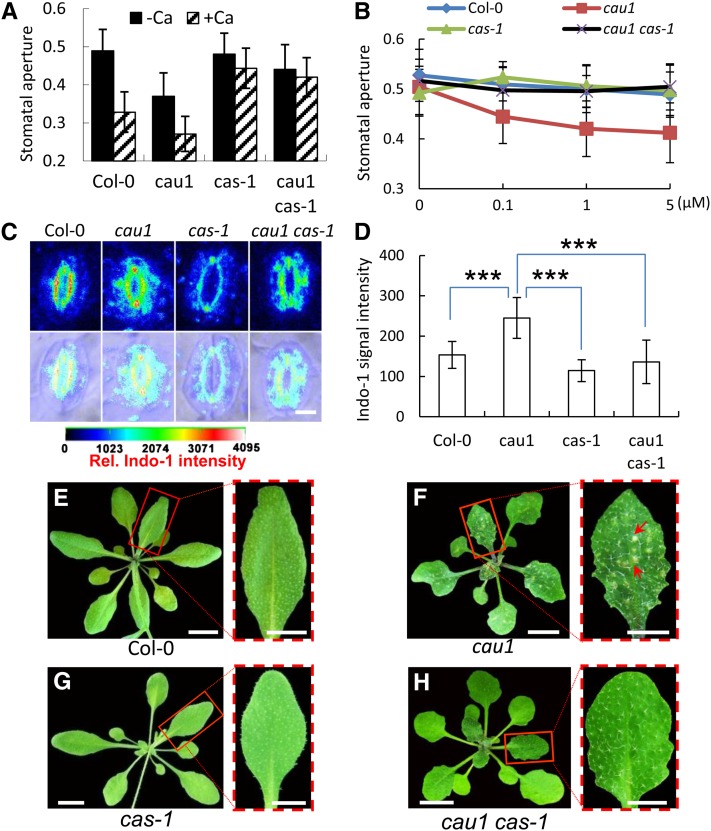
(A) and (B) [Ca2+]o-induced stomatal closure in plants. As described in Methods, 2 mM Ca2+ (A) or a final concentration of 0, 0.1, 1, or 5 μM Ca2+ (B) was added, and stomatal aperture was calculated as the ratio of pore width/length. n > 120 stomata per Ca2+ treatment, and values are mean ± sd.
(C) Representative imaging of [Ca2+]cyt in stomata of the wild type, cau1, cas-1, and double mutant cau1 cas-1 by Indo-1 staining and UV confocal assay. The first row shows fluorescence images, and the second row shows merged fluorescence and bright-field images. [Ca2+]cyt was calibrated and pseudo-color-coded according to the color scale shown.
(D) Quantification of the relative Indo-1 fluorescence intensities indicating [Ca2+]cyt levels in stomata of the wild type, cau1, cas-1, and cau1 cas-1. Values are mean ± sd, n = 46. ***P < 0.001 in t tests.
(E) to (H) Chlorotic lesions in leaves of the wild type (E), cau1 (F), cas-1 (G), and cau1 cas-1 (H) exposed to calcium starvation. Each red dash-framed panel represents a scale-up of one corresponding leaf from (E) to (H).
Bars = 5 µM in (C), 1 cm in (E) to (H), and 0.5 cm in the dash-framed panels.

