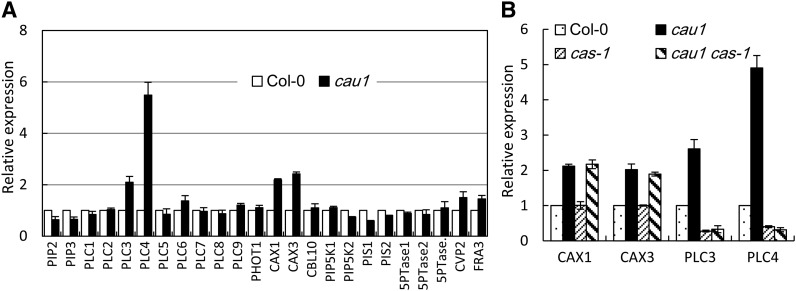
Figure 7.
Analysis of Expression Levels of Ca2+ Homeostasis or Signaling Pathway Genes.
(A) Quantitative determination of expression levels of genes involved in the IP3 pathway or Ca2+ homeostasis.
(B) Expression of CAX1, CAX3, PLC3, and PLC4 in cau1, cas-1, and cau1 cas-1 plants. Plants were grown to 28 d old in soil.
The y axes show RNA levels normalized to those of ACTIN2. Values are mean ± se, n = 3.

