Figure 1.
AP-2 Localizes to the Plasma Membrane and Cytosol.
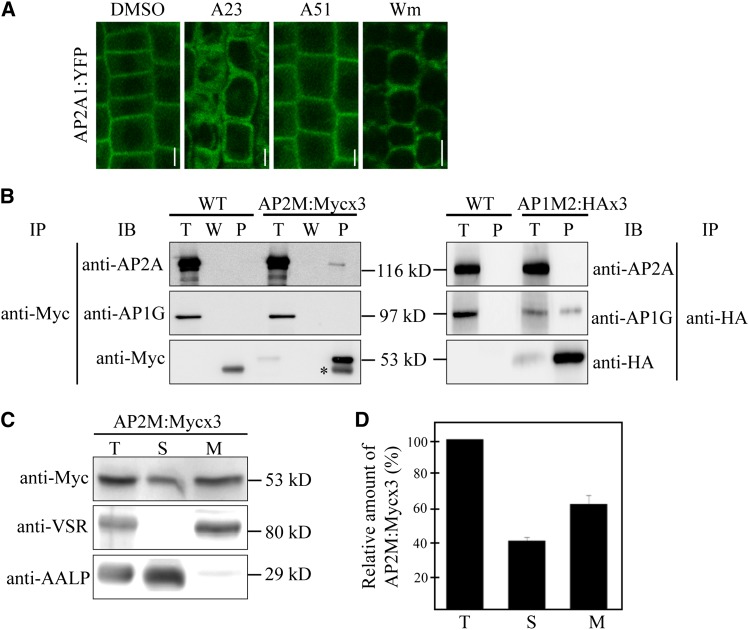
(A) Localization of AP2A1:YFP. The localization of AP2A1:YFP expressed in transgenic plants was examined in root cells after treating with DMSO, 30 μM Tyrphostin A23 (A23), or 30 μM Tyrphostin A51 (A51) for 2 h or 33 μM Wortmannin (Wm) for 1 h. Images were taken using a confocal laser scanning microscope. Bar = 10 μm.
(B) Specific interaction of AP2M with AP2A but not AP1G. Protein extracts from transgenic plants expressing AP2M:Mycx3 or AP1M:HAx3 were subjected to immunoprecipitation with anti-Myc or anti-HA antibodies, respectively, and the precipitates were analyzed by protein gel blotting using anti-AP2A, anti-AP1G, anti-Myc, or anti-HA antibodies. T, total protein extracts; W, washing-off solution; P; immunoprecipitates. IB, immunoblot; IP, immunoprecipitation; asterisk, Ig-G heavy chain; WT, the wild type.
(C) Subcellular fractionation of AP2M. Protein extracts from AP2M:Mycx3 transgenic plants were separated into soluble and membrane fractions by ultracentrifugation at 100,000g for 1 h. Soluble and pellet fractions were detected by anti-Myc, anti-AALP, or anti-VSR antibodies. T, total plant extracts; S, soluble fraction; M, membrane fraction.
(D) Quantification of soluble and membrane fractions of AP2M. To quantify the expression level of soluble and membrane fraction of AP2M:Mycx3, the signal intensity of protein on immunoblots was measured using software associated with the Luminescent Images Analyzer LAS3000 (Fujifilm). Error bar indicates sd (n = 3).

