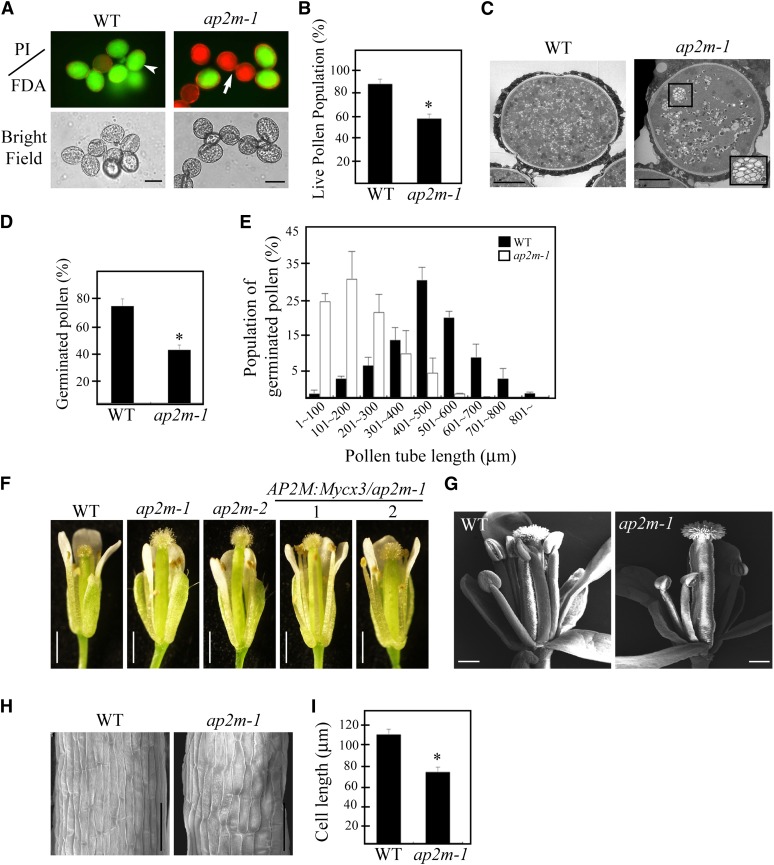
Figure 4.
ap2m-1 Plants Have Defects in Pollen Biogenesis, Pollen Tube Elongation, and Growth of Stamen Filaments.
(A) and (B) Defect in pollen viability.
(A) Viability of pollen grains from wild-type (WT) or ap2m-1 plants was tested by staining with propidium iodide (PI; 1 µg/mL) (red fluorescence, arrow) or FDA (0.5 µg/mL) (green fluorescence, arrowhead). Bar = 10 µm.
(B) To quantify the viability of pollen grains, pollen grains that stained with FDA were counted. Error bar indicates se (n = 3500 for wild-type and 4130 for ap2m-1 plants). Statistical analysis was performed between wild-type and ap2m-1 mutants using Student’s t test (*P < 0.01).
(C) A defect in vacuole degeneration in ap2m-1 mutant plants. Ultrathin sections from anthers at the flower stage 13 were prepared and the cross sections of pollen mother cells were examined by electron microscopy. Inset: the enlarged image of the boxed area. Bar = 5 μm.
(D) and (E) Defects of pollen germination and pollen tube growth.
(D) To quantify germination rate, pollen grains were germinated on agarose medium and incubated for 4 h at room temperature for the elongation of pollen tubes. The number of pollen grains with pollen tube regardless of its length was counted. Error bar indicates se (n = 30). Statistical analysis was performed between wild-type and ap2m-1 mutants using Student’s t test (*P < 0.01).
(E) The length of individual pollen tubes was measured and the distribution pattern of the average pollen tube length in a group of 100 pollen grains was presented. Three independent measurements were performed. Error bar indicates se (n = 1500 for the wild type, and n = 2110 for ap2m-1).
(F) and (G) A defect in growth of stamen filaments.
(F) Image of a whole flower with filaments; the wild type, two independent alleles (ap2m-1 and ap2m-2), and two lines of complemented ap2m-1 plants with AP2M:Mycx3-1 or AP2M:Mycx3-2. Bar = 1 cm.
(G) Scanning electron microscopy image of flowers. Bar = 200 μm.
(H) Scanning electron microscopy images of filaments showing a defect in cell elongation. Bar = 50 μm.
(I) The length of single cells was quantified. Error bar indicates se (n = 30). Statistical analysis was performed between the wild type and ap2m-1 mutants using Student’s t test (*P < 0.01).

