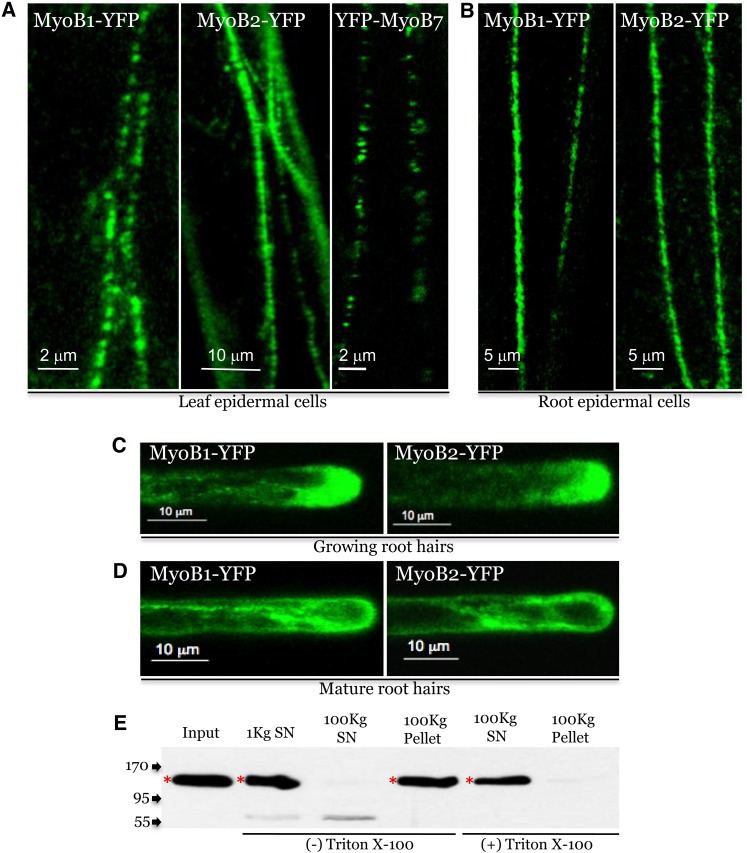
Figure 2.
Subcellular Localization of MyoB1-YFP and MyoB2-YFP.
(A) Confocal images of leaf midvein epidermal cells expressing MyoB1-YFP, MyoB2-YFP, and YFP-MyoB7 in myob1 and myob2 genetic backgrounds, respectively.
(B) Analogous images of the root epidermal cells expressing MyoB1-YFP and MyoB2-YFP in myob1 and myob2 genetic backgrounds, respectively.
(C) and (D) Confocal images of growing (C) and mature (D) root hairs expressing MyoB1-YFP and MyoB2-YFP.
(E) Subcellular fractionation of leaf extracts from myob1 MyoB1-YFP plants. The 1000 g and 100,000 g supernatants (1Kg SN and 100Kg SN, respectively) and the pellets in the presence (+) or absence (−) of Triton X-100 were analyzed using immunoblotting with GFP-specific monoclonal antibody. Arrows at the left show protein marker positions with their molecular mass in kilodaltons; red asterisks mark full-size protein bands; bands of lower molecular mass probably correspond to protein degradation products.

