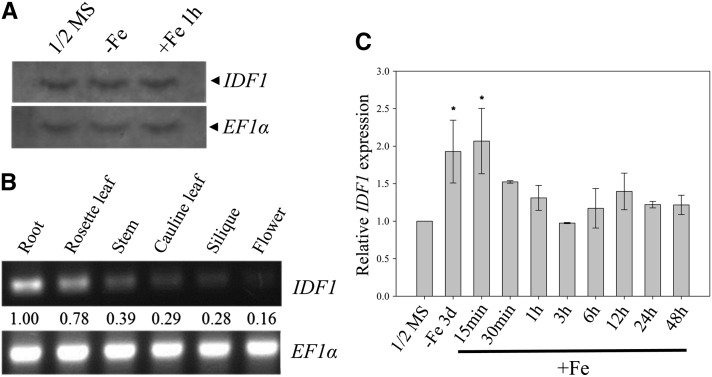
Figure 4.
Expression of IDF1.
(A) Accumulation of IDF1 transcripts in the roots of 14-d-old plants treated with half-strength MS or in Fe-deficient conditions for 3 d (-Fe), followed by resupply of Fe for 1 h (+Fe 1 h). EF1α transcript levels were used as the loading control.
(B) RT-PCR (30 cycles) of IDF1 in various tissues as indicated. The expression of EF1α was used as an internal control. Relative expression levels are indicated.
(C) Real-time quantitative RT-PCR monitoring of IDF1 transcript accumulation in roots of the wild type under various treatments as indicated. *Relative expression >1.5-fold compared with the wild type in half-strength MS.

