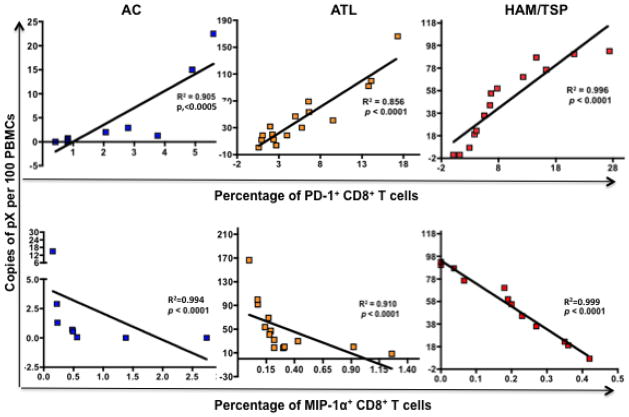
Figure 7.
Correlation between PD-1 and MIP-1α expression on total CD8+ T cells with proviral load in ACs, ATL and HAM/TSP patients. Upper panel: proviral loads of ACs, ATL, and HAM/TSP patients (as plotted in Fig. 1) were correlated to the amount of PD-1 expressed on total CD8+ T cells (after stimulation of PBMCs with CEF, SEB, and Tax) in each sample and plotted on X-Y scatter. A Spearman correlation was calculated using Prism 4.0 C software. Both R2 and P values are reported. Lower panel; Similar to PD-1, MIP-1α expression was correlated to the proviral load.

