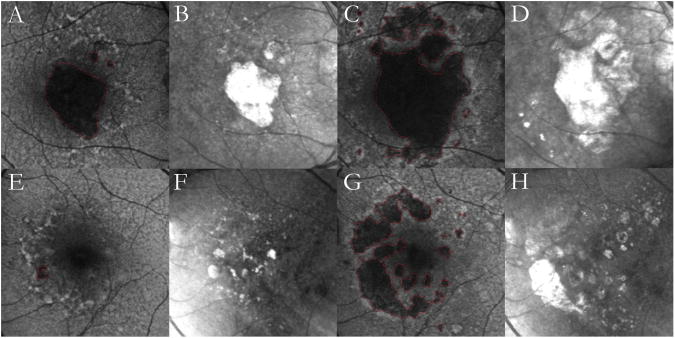
Figure 6. Progression of multilobular geographic atrophy (GA) over a period of 3 years.
(Top row) Right eye. (Bottom row) Left eye. (Columns 1, 2) Initial autofluorescence (AF) and infrared (IR) images. The individual GA lobules in the AF images are outlined in red using our user-interactive GA segmentation tool.24, 25 (Columns 3, 4) Follow-up AF and IR images after 3 years. The large central atrophic lesion in the right eye is present both initially and finally as seen in AF (top row, columns 1, 3) and IR (top row, columns 2, 4) scans; the GA in this eye appears to be a coalescence of densely packed atrophic lobules. The initial AF scan of the left eye (bottom left) shows prominent reticular macular disease in all quadrants with a small lesion of GA beginning to form within it. The atrophic areas are less apparent in the IR images (bottom row, columns 2, 4) compared to the well-outlined lobules of atrophy observed in the AF images (bottom row, columns 1, 3). After 3 years, there are significant new lobules of GA evident in all quadrants of the left eye.

