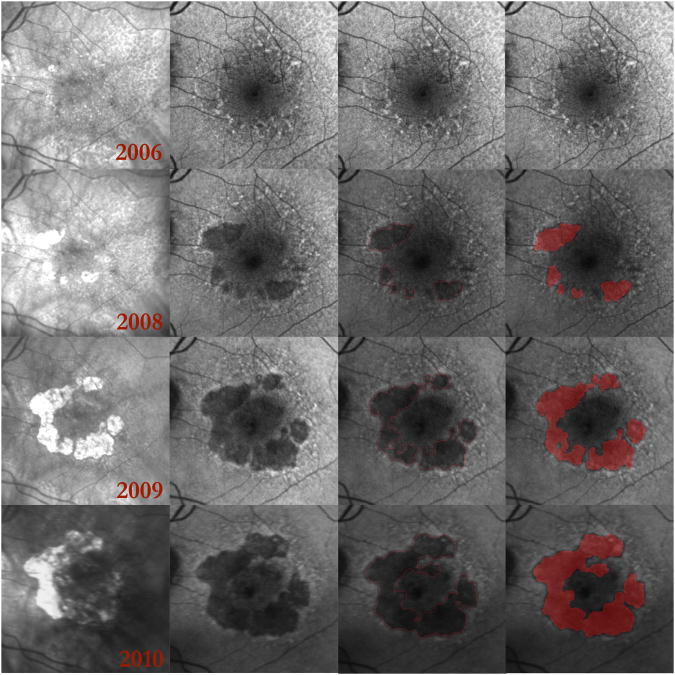
Figure 7. Multilobular geographic atrophy (GA) and reticular macular disease (RMD) over 4 years presented as a multiscale, multistage disease continuum.
Each row represents 1 year of serial infrared (IR) and autofluorescence (AF) images. (Column 1) Serial IR images show enlargement of GA. (Column 2) Serial AF images show RMD (small-scale, early lesions) becoming gradually more hypoautofluorescent and coalescing into lobes of early GA (larger scale, later-stage lesions), which further coalesce and become even more hypoautofluorescent as they progress to mature GA (large-scale, end-stage lesions). Note that the AF lesions have distinct, decreasing gray scales as they progress from RMD to lobules of early GA and on to fully developed GA. The IR images do not show this distinction. The end-stage AF lesions (2010) are closely surrounded by irregular margins of elevated AF that in turn are surrounded by RMD. At each stage, RMD is clearly visible at the margins of the GA. (Column 3) The GA lesions in the serial AF images from Column 2 were outlined in red.24, 25 The segmentation included both early- and end-stage GA and included all areas of defined atrophy in the IR scans. (Column 4) Red masks were created in MATLAB R2007 (Mathworks, Natick, MA) for the serial AF images in Column 2 to measure the growth of atrophic lesions over 4 years.

