Figure 1.
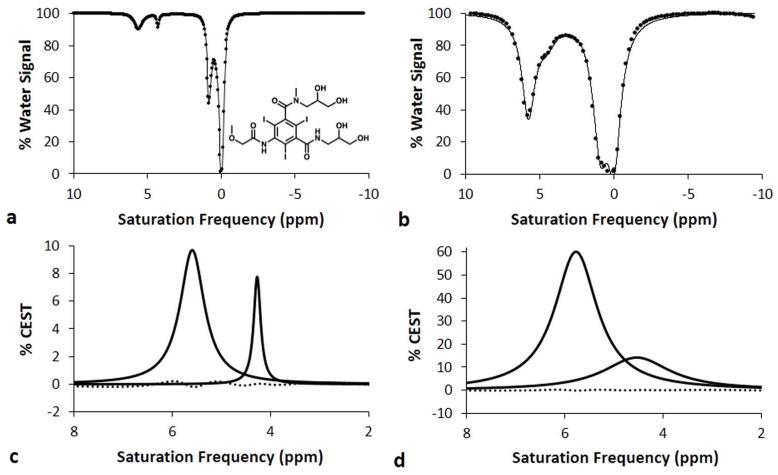
Representative Lorentzian line shapes fitted to simulated CEST spectra of iopromide at a) 1 μT saturation power and b) 5 μT saturation power, with a 1 second saturation time, 1000 Hz chemical exchange rate, 200 mM concentration, and 3 second T1w relaxation time. The chemical structure of iopromide is shown in the inset. The CEST effect at 5.6 ppm arises from the amide proton between the ring and carbonyl group, while the CEST effect at 4.2 ppm arises from the amide proton between the diol group and the carbonyl group. The CEST effect at 0.8 ppm arises from the diol groups, and the direct saturation of water is shown as a line shape at 0 ppm. Lorentzian line shape spectra generated from the fitting process show the CEST effects from the amides at c) 1 μT saturation power and d) 5 μT saturation power. The residuals of the fitting processes are shown as a dotted line.

