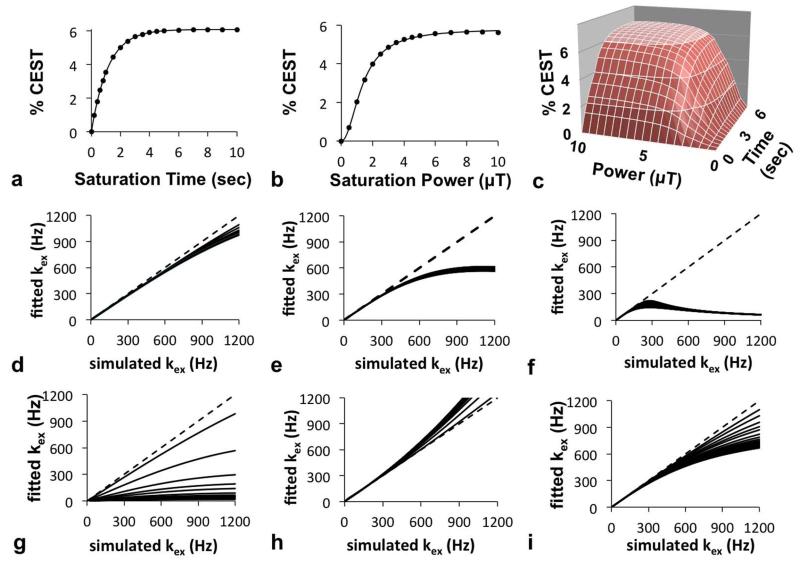
Figure 2.
QUEST, QUESP, and QUESPT analyses of simulated CEST MRI results. a) A representative QUEST fitting of simulated results generated with 10 μT saturation power, 25 Hz chemical exchange rate, and 1.5 second T1w relaxation time; b) A representative QUESP fitting with simulated results generated with 10 second saturation time, 350 Hz chemical exchange rate, and 0.1 second T1w relaxation time; c) A representative QUESPT fitting with simulated results generated with a 25 Hz chemical exchange rate and 1.5 second T1w relaxation time. The exchange rates estimated with QUEST at d) 10 μT, e) 4 μT, and f) 1 μT saturation power at short (*) and long (●) T1w relaxation times showed that QUEST accurately estimated slow kex rates, but required high saturation power to accurately estimate fast kex, with a minor dependence on T1w relaxation times. The exchange rates estimated with QUESP g) with fixed T1w and T2w relaxation times ranging from short (*) to long (●) estimated fast kex with poor accuracy, h) while allowing T1w and T2w to be fitted improved the accuracy of estimating fast kex. i) The estimations of exchange rates with QUESPT showed a result that was intermediate between the results from QUEST and QUESP methods. For graphs d-i, a dashed line with slope=1 is shown to aid visualization of the results.

