Figure 3.
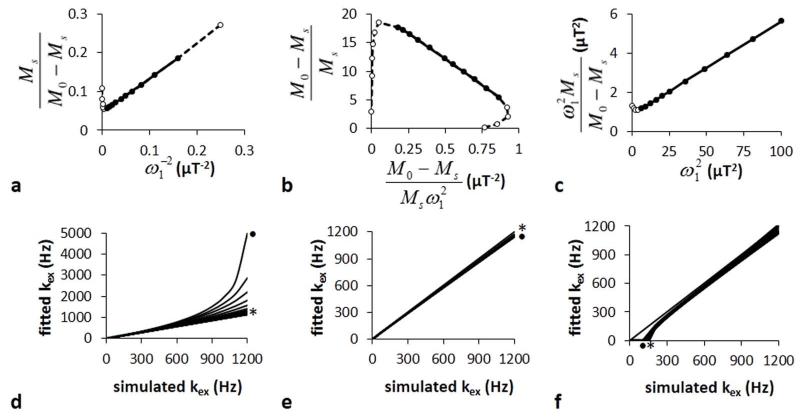
LB-QUESP, EH-QUESP and HW-QUESP analyses of simulated CEST MRI results generated with a 10 second saturation time, 1200 Hz chemical exchange rate, and 10 second T1w relaxation time. A representative a) LB-QUESP, b) EH-QUESP, and c) HW-QUESP fitting of simulated CEST results were used to estimate kex. d) The kex estimated with LB-QUESP at short (*) and long (●) T1w relaxation times accurately estimated slow exchange rates, but failed to accurately estimate fast exchange rates. e) EH-QUESP accurately estimated slow and fast exchange rates, and f) HW-QUESP accurately estimated fast exchange rates, with little dependence on T1w relaxation times.

